

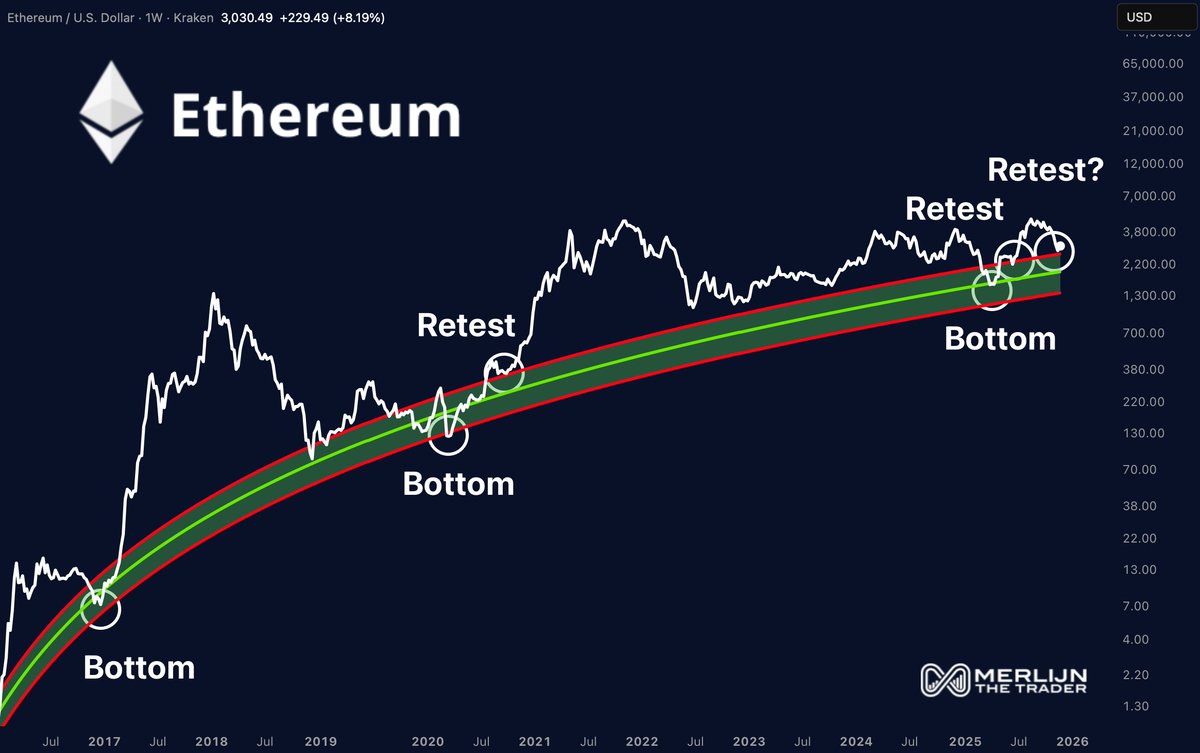
Ethereum is once again approaching the same long-term trendline that has defined every major bottom and expansion phase since 2016. The chart highlights a green accumulation band that has acted as a generational entry zone for nearly a decade. Each time ETH has fallen into this area, the market has responded with a fresh cycle of growth.
The Trendline That Has Never Failed
Across 2017, 2020, and 2025, Ethereum followed the same sequence: a sharp decline, a retest of the lower green band, and a broad expansion phase that carried the price into new highs. The pattern hasn’t broken once in nine years, and the latest move places ETH directly back on this historic support. According to the chart, both the 2020 and 2025 bull cycles began from this exact region.
What the Current Setup Shows
The image clearly marks earlier bottoms and retests, showing how ETH repeatedly returned to the green band before launching its strongest rallies. The latest price action now sits on that same structure, labeled as a possible new retest zone. The implication is simple: Ethereum is revisiting the same long-term support that has consistently generated cycle-defining reversals.
Ethereum is once again approaching the same long-term trendline that has defined every major bottom and expansion phase since 2016.
Why This Moment Matters
If this trendline continues to hold, Ethereum could be approaching a turning point similar to previous cycles. The chart suggests that the market is not breaking pattern but instead repeating a familiar long-term rhythm. Traders watching this structure will see the current region as one of the most historically reliable points for major directional shifts.