

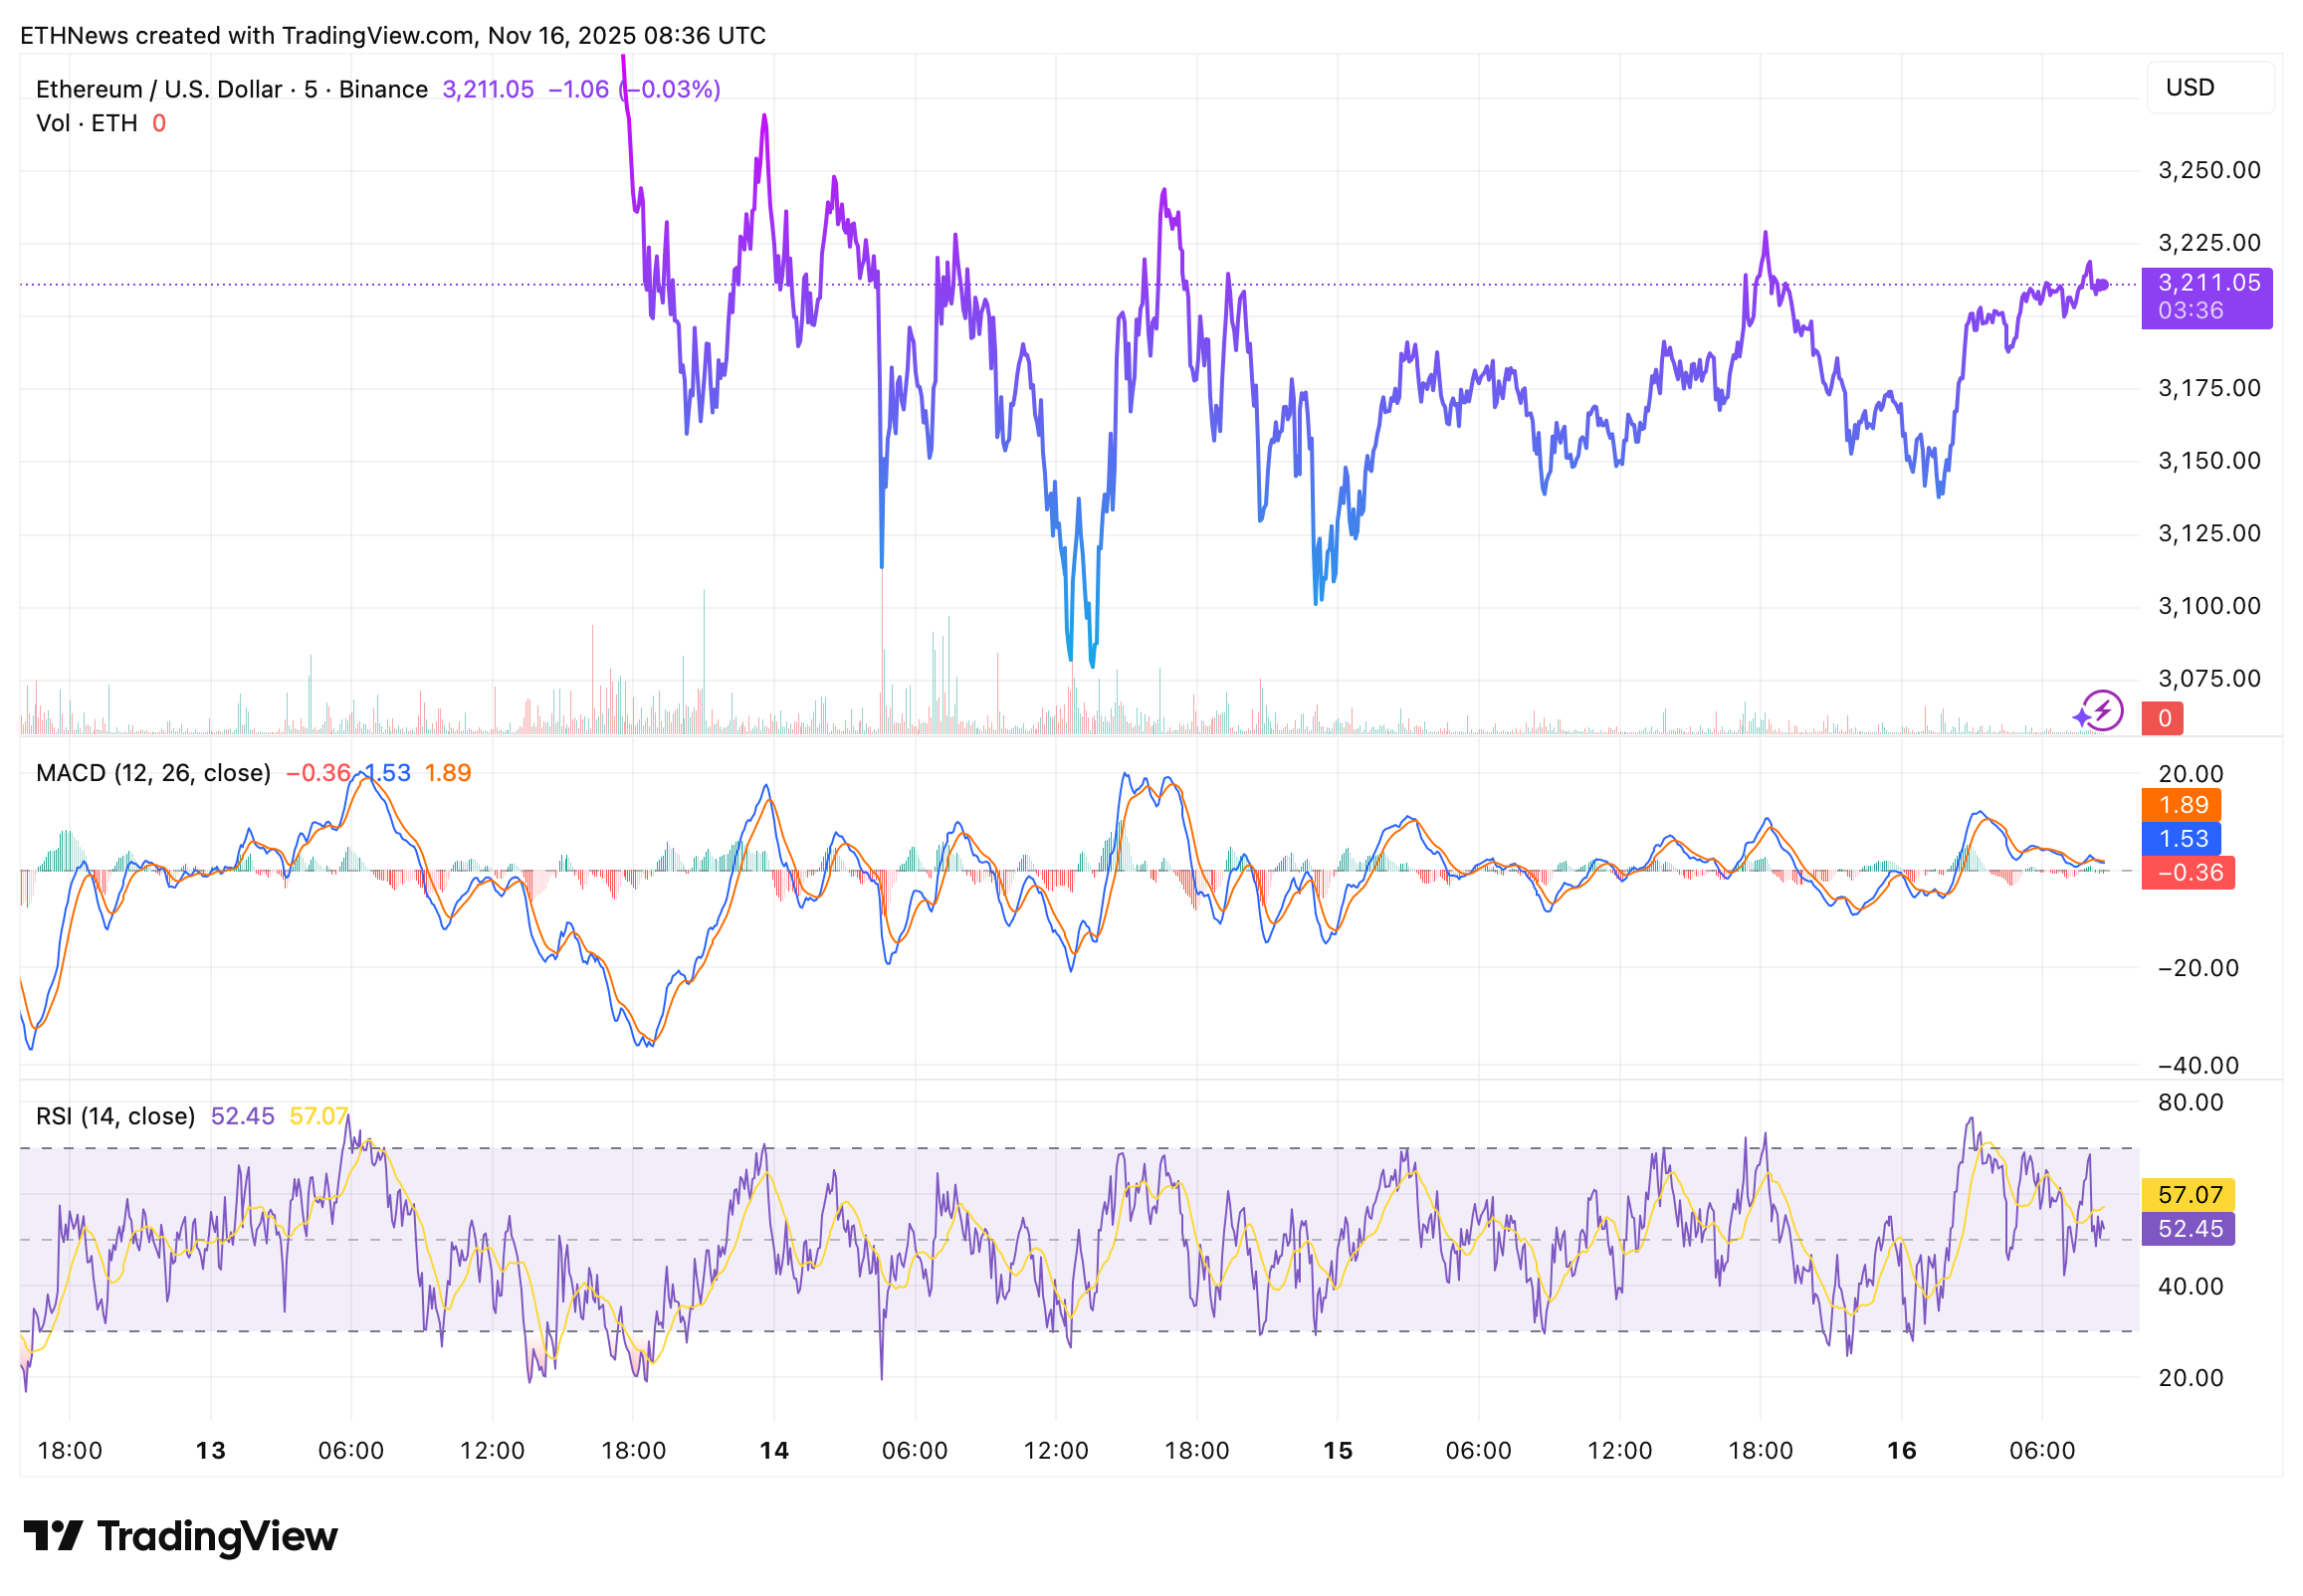
Ethereum continues to trade under pressure, slipping to the $3,210 zone early Saturday as the broader market faces renewed volatility. Fresh data shows ETH remains below both the 7-day and 30-day moving averages, confirming a short-term bearish trend that has steadily intensified over the past week.
According to 10x Research, ETH has recorded a -6% weekly performance, driven largely by sharp outflows from Ethereum exchange-traded funds. More than $1 billion exited ETH ETFs over the past several days, marking one of the heaviest withdrawal periods since their approval.
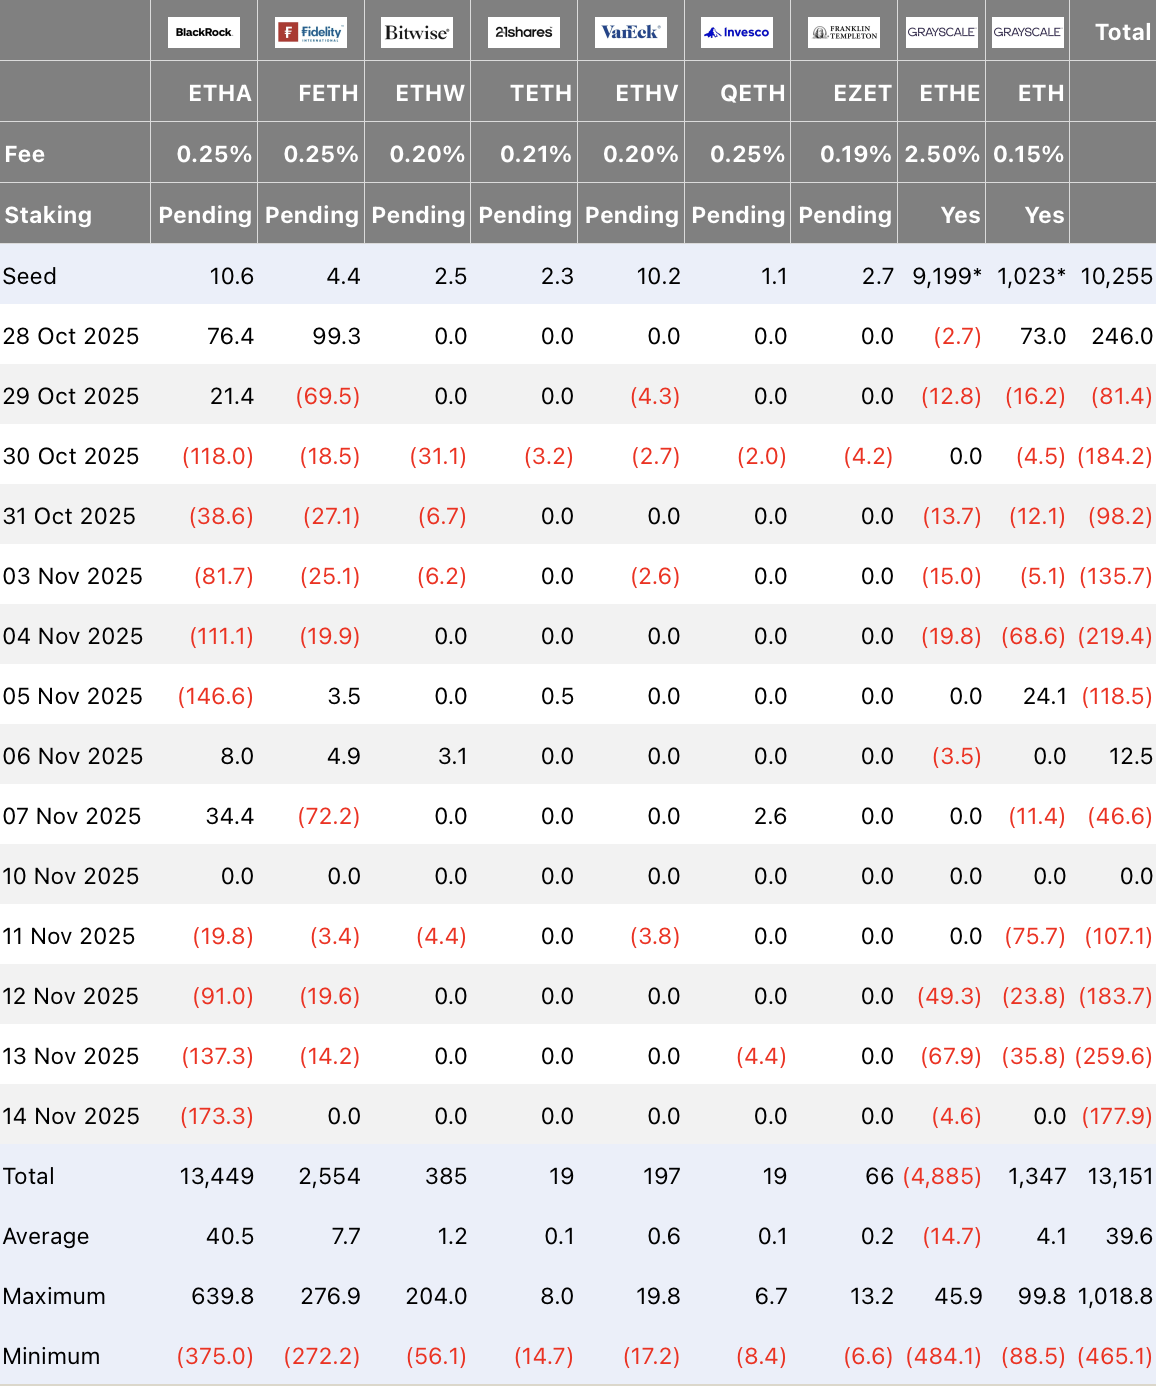
Heavy ETF Outflows and Long-Term Holder Selling Add Strong Supply Pressure
Market analysts warn that ETF outflows are only part of the challenge. On-chain data reveals that long-term Ethereum holders, addresses holding ETH for 3 to 10+ years, are selling at their fastest pace since 2021, a period that previously aligned with deep corrections.
10x Research reports that several large “whale” addresses accumulated hundreds of thousands of ETH during the latest dip, totaling over $1 billion worth of inflows into top wallets. However, on net, supply has increased on exchanges as long-term holders take profit or derisk ahead of macro uncertainty.
This creates a two-sided situation: whales are buying aggressively, but long-term holders are selling faster, a dynamic that historically leads to short-term volatility until demand overtakes supply.
Relative Performance vs. Bitcoin Turns Negative Again
The relative ETH/BTC trend, a key metric watched by institutional desks, has also deteriorated. 10x Research highlights that ETH’s performance against Bitcoin has fallen to its weakest point in weeks, signaling rotation into BTC during sell-offs.
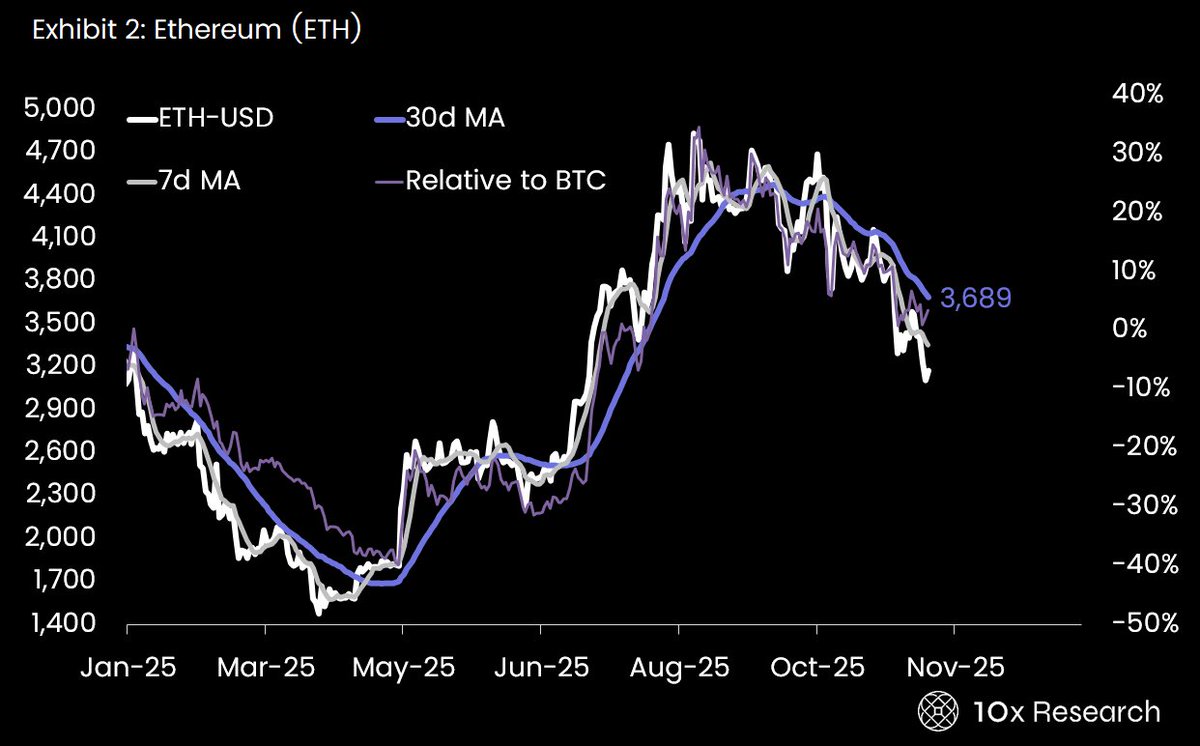
This aligns with recent market behavior where Bitcoin has become the preferred asset for defensive positioning, despite its own volatility.
Technical Indicators Flash Mixed Signals Ahead of Crucial Weekend Close
Ethereum’s short-timeframe indicators show mild improvement but remain far from bullish confirmation:
- •RSI sits near 52–57, signaling neutral momentum.
- •MACD is slightly above the signal line on the 5-minute frame but still shows no clear upward crossover on higher timeframes.
- •Price remains well below the key $3,350–$3,420 resistance zone, which has repeatedly rejected rallies this month.
More importantly, ETH’s daily chart shows price slipping under the 30-day moving average, a trendline that acted as support throughout Q3 and Q4. Losing this structure opens the door to a potential move toward $3,050, and below that, the high-liquidity area near $2,900.
What Traders Are Watching Next
Ethereum now sits at a critical juncture heading into the weekend. Analysts highlight the following levels:
- •$3,250–$3,300 → Short-term resistance
- •$3,120 → Immediate intraday support
- •$3,050 → Stronger demand area
- •$2,900 → Major liquidity pool and key medium-term support
A recovery above $3,350 would be the first sign of momentum returning, while a breakdown under $3,120 could accelerate corrective pressure.
For now, ETH remains in a defensive posture, weighed down by ETF withdrawals, long-term holder selling, and sliding relative strength, as traders wait for clearer reversal signals.