

Market Overview
Ethereum moves through heavy volatility as new on-chain data reveals a dense cost basis cluster near $3,150. Recent market activity shows rising liquidations and long-biased positioning, shaping short-term reactions around the most prominent support zone.
- •Cost basis data shows 2.53M ETH acquired at $3,150, forming a major structural support region for the market.
- •Rising liquidations and long-heavy positioning shape short-term volatility as price trades near critical support.
- •Elevated open interest and strong long ratios reflect active market participation during the latest decline.
Cost Basis Cluster Forms Key Market Support
Ethereum shows a concentrated support area near $3,150 after Ali (@ali_charts) reported that 2.53 million ETH were bought at this level. The chart from Glassnode presents a cost basis distribution heatmap that maps heavy acquisition zones across recent months. The warm-toned band near $3,150 forms one of the strongest accumulation layers within the current market structure.
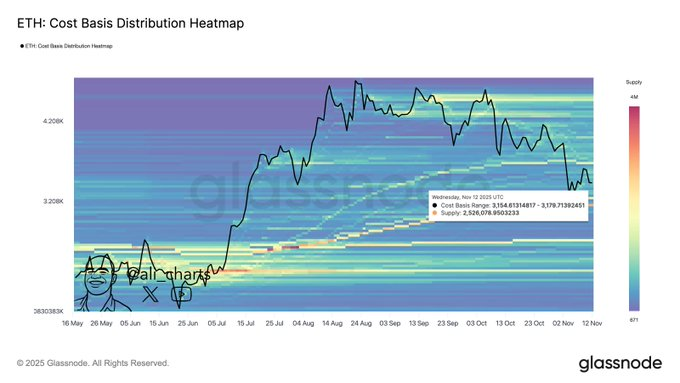
The heatmap displays horizontal clusters where large amounts of supply changed hands. Warmer colors represent heavier concentrations and signal areas where holders often defend entries during pullbacks. This cluster began forming in late June and expanded through July, creating a priced anchor that many market participants reference during periods of stress.
Above this zone, the chart shows lighter accumulation bands as price moved toward the $4,000 area. These thinner regions suggest weaker structural support overhead, increasing the importance of the $3,150 level. If the market corrects further, this zone remains the nearest foundation capable of absorbing selling pressure from recent volatility.
Price Weakness Intensifies as Sell Pressure Increases
Ethereum at the time of writing trades at approximately $3,168 after plunging downward against over $3,500 in the last 24 hours. The chart shows a steady decline with limited attempts at recovery until a minor bounce near the end of the session. The downtrend reflects persistent sell-side momentum during a high-volume trading period.
Performance metrics confirm broader weakness. The asset has decreased by 9.28% within 24 hours and a 5.22% pullback after seven days. The 30-day decline is close to 23.02%, and the performance of 90 days is falling at 28.47%. Even with these losses, the 180-day figure remains positive at 28.28%, showing the market still holds gains from earlier cycles.
Trading volumes remain elevated across major exchanges. Binance futures recorded more than $27 billion in volume during the last session, reflecting active repositioning during the decline. High volumes during selloffs often show rapid forced adjustments as traders respond to changing structural levels across the market.
Derivatives Positioning Drives Short-Term Market Reaction
Ethereum derivatives data shows a strong long bias on major platforms such as Binance and OKX. Long/short ratios remain above 3.0 on both exchanges, with top-trader metrics showing even heavier long exposure. This positioning reflects expectations for stabilization, even as the market faces downward pressure.
Liquidation figures show how this imbalance affects the latest decline. More than $51 million were liquidated within one hour, with long positions carrying most losses. The four-hour total exceeded $57 million, suggesting that forced unwinds contributed to sharp intraday movements as cascading orders pushed prices lower.
Open interest increased by over 49% during the decline, showing high engagement through the downturn. Rising open interest during falling prices often signals attempts to defend positions or buy into weakness. Combined with the cost basis cluster near $3,150, these derivatives trends frame the market’s most important support context for Ethereum as volatility continues.