

Ethereum may be nearing the final chapter of a multi-year pattern, according to market analyst Gert van Lagen, who highlighted a textbook Expanding Diagonal structure now approaching completion. His bi-weekly chart suggests that ETH is progressing through the final corrective sequence, an a-b-c formation, with the last wave potentially preparing for a powerful breakout.
Wave v Enters Its Final Stages
The structure van Lagen outlines places Ethereum deep inside Wave v of the diagonal, a phase that typically concludes a larger trend. Wave a within this final move has already shown strength, pushing above the key horizontal barrier at $3,650, an area that previously capped multiple attempts to climb higher.
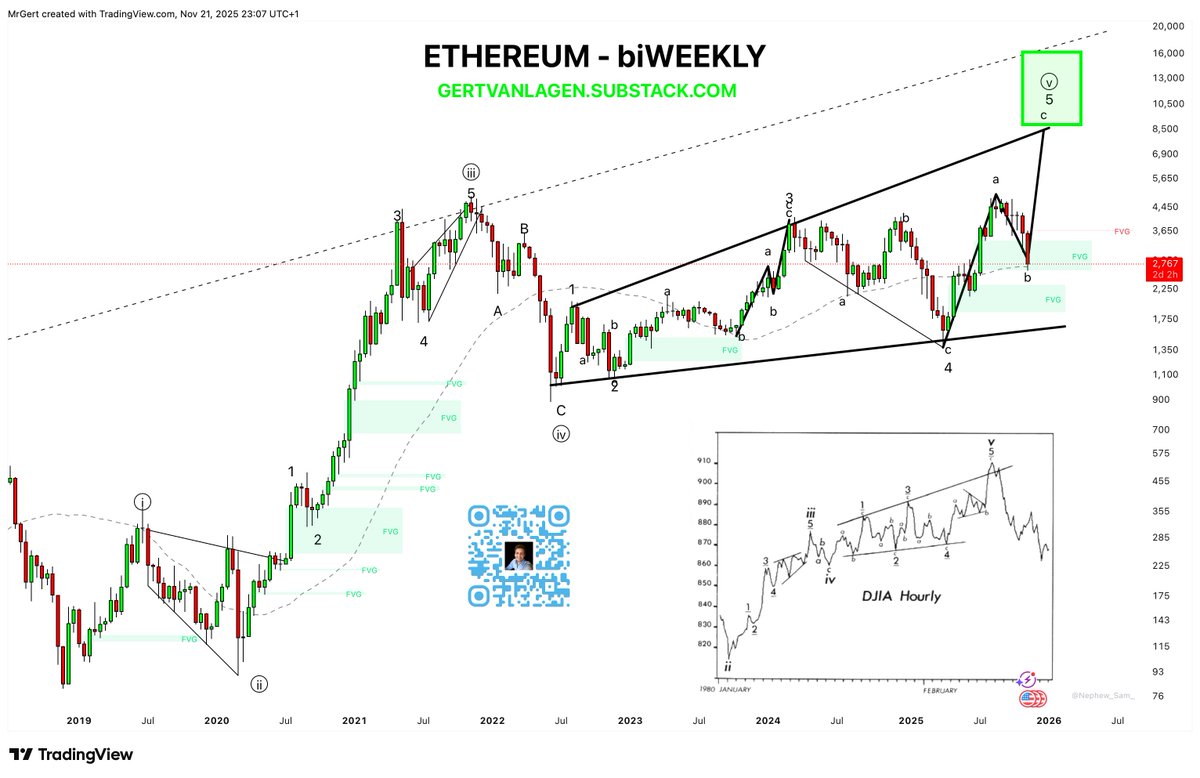
Wave b is now retracing into a major liquidity zone defined by a Fair Value Gap (FVG) and a higher-timeframe simple moving average cluster. Van Lagen frames this zone as a natural support area within the diagonal’s expanding structure.
Why the Liquidity Zone Matters
In expanding diagonal patterns, broadening trend lines often produce deeper and more volatile mid-pattern retracements. According to van Lagen, Ethereum’s current price action fits this template cleanly: expanding highs, expanding lows, and corrective waves that interact with liquidity pockets rather than invalidating the structure.
Wave b’s reaction here will be crucial. A sustained hold above this region strengthens the scenario in which the final wave, wave c, triggers a decisive upward impulse.
A Potentially Explosive Final Leg
If the pattern plays out as outlined, the concluding move could be the most dramatic. Van Lagen’s green target zone, the projected destination for wave c, sits between $9,000 and $18,000, a range aligned with measured diagonal extensions.
This target band represents the broad top of the expanding formation, and historically, structures like this often resolve with sharp, climactic moves once the final impulse begins.
Bigger Picture: A Multi-Year Formation Nearing Its End
Ethereum has spent years developing this diagonal, starting in 2019 and gradually widening through successive cycles. Van Lagen’s chart even includes a reference to a similar pattern in the Dow Jones Industrial Average, reinforcing the idea that expanding diagonals can precede powerful transitional moves in major assets.
With wave v approaching its conclusion and liquidity aligning below current prices, the chart suggests that Ethereum may be nearing a pivotal moment.