

The price of FET has entered a critical zone that is closely watched by long-term traders. Following a significant decline from its cycle highs, FET is now positioned in an area that historically differentiates projects that fade away from those that manage to reset and rebound strongly.
The primary question is not whether FET will exhibit volatility, which is expected, but rather if this current price level signifies the commencement of a genuine accumulation phase or merely a temporary pause before further declines.
Analyzing the Broader FET Price Picture
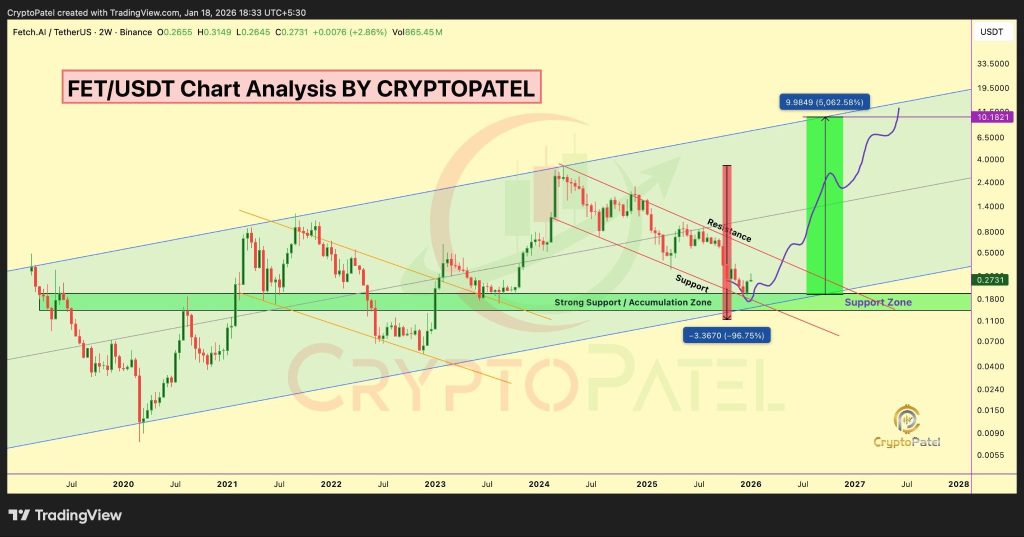
When examining higher time frame charts, FET has been trading within a broad ascending channel that has been consistently respected since 2020, indicating a significant long-term trend.
Despite experiencing a nearly 97% drop from its all-time high, the FET price has not collapsed entirely. Instead, it has returned to the lower boundary of this long-term channel, where buying interest has emerged.
This pattern typically suggests a reset rather than a complete breakdown. When a price retraces deeply but maintains its macro structure, it often implies that long-term investors are re-entering the market rather than exiting.
The demand zone between $0.19 and $0.20 is particularly noteworthy, as it has acted as a stable floor for the price. As long as the FET price remains above this range, the overarching bullish outlook remains technically valid.
The Significance of the Current Support Zone for FET
Support zones gain substantial importance when multiple technical factors converge at the same price level, which is precisely what is occurring for FET.
The lower boundary of the long-term channel and the horizontal demand zone are nearly overlapping. This confluence is a key indicator for long-term traders, as it clearly defines the risk and reward parameters.
In essence, this provides the market with a clear demarcation. A sustained close below $0.19 on a higher time frame would significantly weaken the bullish setup. However, as long as this level holds, the chart continues to favor a bullish trajectory.
Current price action supports this view; the FET price is no longer accelerating downwards. Instead, it is consolidating and stabilizing, which is often characteristic of the initial stages of an accumulation phase following a substantial correction.
Potential for Upside Movement
The price targets of $0.60, $1, $2.80, $5, and even $10, as suggested by CryptoPatel, may initially seem ambitious. However, when plotted on the chart, these levels align with previous value zones and the upper boundary of the long-term channel.
A movement towards $0.60 would serve as the first indication of a trend shift rather than a mere bounce. From there, reclaiming the $1 and $2.80 regions would return the FET price to levels that were significant in earlier cycles.
The higher targets near $5 and $10 would only become viable if the broader Artificial Intelligence (AI) narrative and overall market conditions support a comprehensive macro recovery, extending beyond a short-lived relief rally.
It is crucial to view these levels as potential long-term scenarios rather than immediate guarantees. They outline what becomes achievable if the established structure, demand, and market momentum align in a unified direction.
As long as the FET price remains above the $0.19 macro support level, the chart's bullish structure is preserved. Whether this eventually leads to a substantial 5000% increase will depend on time, market execution, and the broader market cycle; however, from a technical perspective, the foundational elements for such a move are clearly present.