

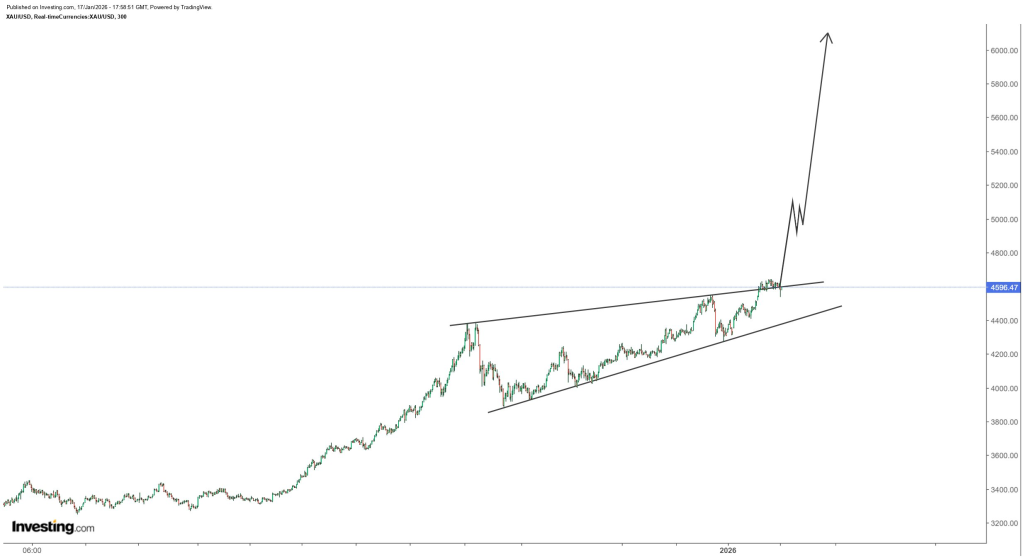
Investment analyst Rashad Hajiyev shared a chart indicating that gold has been steadily increasing within a 3-month ascending wedge formation. The price is currently approaching the upper boundary of this structure, near the $4,600 mark.
This ascending wedge is defined by two upward-sloping trendlines. The lower trendline has consistently supported pullbacks, creating higher lows, while the upper trendline has capped rallies, resulting in higher highs that are nonetheless controlled. This pattern suggests a period of building pressure, characterized by a slow and steady upward movement rather than volatile fluctuations.
Currently, the gold price is positioned at the ceiling of the wedge, approximately at $4,596. This juncture is often a critical point where a chart's behavior shifts from being merely interesting to becoming decisive, leading either to a breakout or a reversal back into the established range.
Key Levels for the Week
The primary level of significance this week is the top of the ascending wedge, with $4,600 serving as a critical line.
If the gold price successfully sustains itself above this wedge ceiling, it will likely transform into support, signaling a potential continuation of the upward trend, which is the scenario Rashad is anticipating. However, if the price fails to hold above this level and falls back below it, the ascending wedge pattern would remain intact, suggesting that the market might experience further consolidation before another attempt at a breakout.
On the downside, the area of concern for mitigating potential losses is between the upper $4,400s and lower $4,500s. This region is significant because it encompasses both the wedge's support line and previous structural resistance. A decisive break below the wedge support would undermine the narrative of a breakout and could lead to a more substantial price correction.
Gold Price: Evaluating the $5.1K First Target
Rashad's initial price target is $5,100, projected within a two-week timeframe. This represents an approximate 11% increase from the current $4,600 level. While this is a significant move for gold, it is not considered an unrealistic target, particularly if the breakout triggers a rapid surge in momentum.
This chart pattern also illustrates why traders often favor wedge breakouts: once the price surpasses the ceiling, there can be a swift upward movement as remaining sellers are quickly absorbed, creating an "air pocket" effect.
Nevertheless, a direct, uninterrupted trajectory to $5,100 is uncommon. A more probable scenario involves breaking above $4,600, followed by a temporary pullback to retest the breakout area, and then a renewed push higher.
The $6K in 3 Months Call: A Look at its Realism
The $6,000 target introduces a higher level of speculation, representing approximately a 30% increase from $4,600 within a three-month period.
While such market movements are possible, especially when market positioning becomes heavily one-sided and momentum accelerates, the likelihood of this target being reached without a significant macroeconomic catalyst is less certain.
Achieving a $6,000 price point in three months would likely require more than just a clean wedge breakout. It would probably need catalysts such as strong expectations for aggressive interest rate cuts, a sustained weakening of the US dollar, or a broad shift towards risk-off sentiment that drives capital into precious metals.
Therefore, Rashad's $6,000 projection should be viewed not as a guaranteed outcome but rather as an indicator of the substantial upside potential that could be unlocked if gold breaks out and maintains its upward trajectory.
The aggressive nature of this call lies in its timeframe. Gold has the capacity for multi-year trends and sudden spikes when market sentiment shifts rapidly. The current chart setup suggests a lean towards a potential spike, but confirmation is still required.