

Ethena is showing signs of renewed activity after a prolonged period of sideways trading. The price action for ENA is becoming increasingly interesting, as it currently tests a critical level that could dictate its next significant movement.
According to analysis from TheLordofEntry, ENA has re-entered the vicinity of the 200-day moving average. This particular moving average has previously acted as resistance, rejecting the price on two separate occasions. This zone is often a pivotal point where assets either experience a substantial upward surge or a significant downturn.
The 200-Day Moving Average: A Crucial Test for ENA
Ethena's ENA is currently trading near the $0.46 mark, positioned just below the 200-day moving average. This trendline has presented a considerable challenge for the price to overcome in recent weeks.
Observing the ENA chart, it is evident that the price has been consolidating within a symmetrical triangle pattern. This pattern indicates increasing pressure as higher lows are being established against resistance found in the $0.47 to $0.48 range.
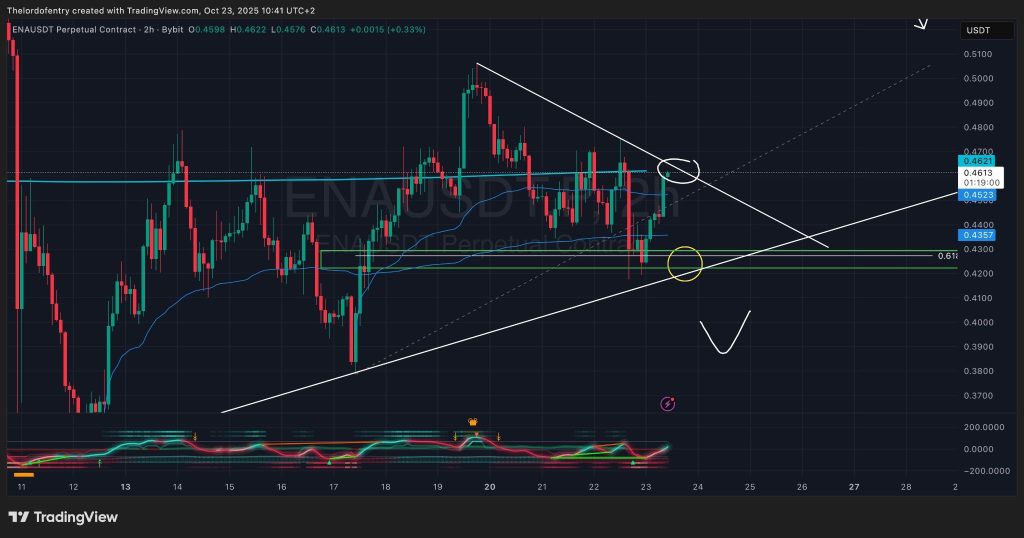
If the ENA price manages to break through this resistance area, a swift ascent towards $0.50 or even $0.52 is a distinct possibility. These levels are typically where a concentration of sell orders is anticipated.
Conversely, if another rejection occurs at this level, the next logical support zone to watch would be around $0.43 to $0.44. This area aligns with the rising trendline and the Fibonacci 0.618 retracement level.
Ethena's Pattern of Higher Lows: A Bullish Indicator
Sjuul from AltCryptoGems is also closely monitoring ENA's performance. His analysis highlights a consistent pattern of higher highs and higher lows on the chart, which is often interpreted as an early sign of accumulation by buyers.
He specifically points to a gray demand zone, located between $0.42 and $0.43, which appears to be functioning as a launchpad for potential upward momentum.
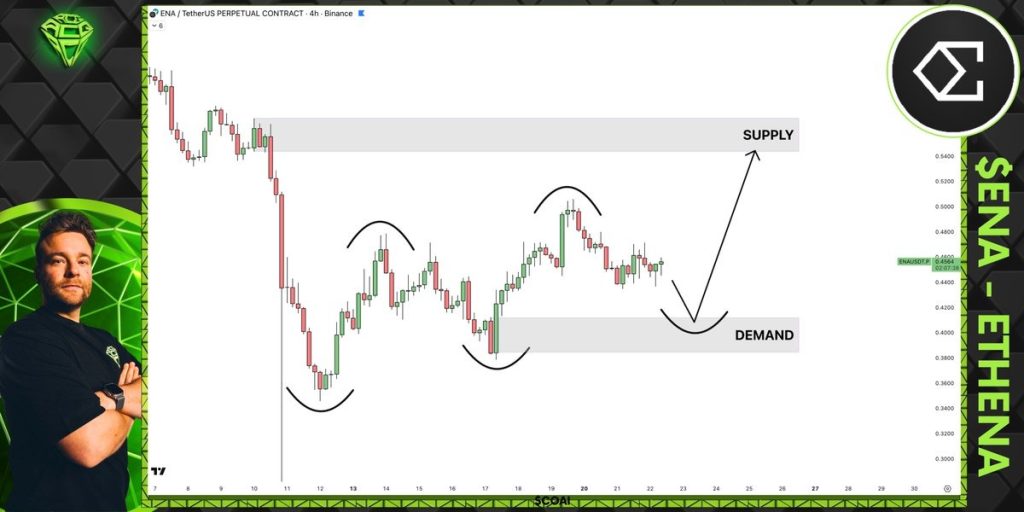
Should this bullish structure remain intact, the next anticipated target for ENA's price is in the $0.52 to $0.54 range. This zone has previously marked areas where upward rallies began to lose momentum.
Sjuul's preferred scenario involves one more bounce from this identified demand box before the price experiences a significant upward expansion.
Potential Outcomes if ENA Breaks Key Resistance
A decisive break and close above the $0.48 level, accompanied by strong trading volume, would serve as confirmation of a bullish reversal for ENA. Such a development could propel the price towards the $0.52 to $0.55 range in the short term, where some traders may begin to secure profits.
Momentum indicators are showing a gradual shift towards bullish sentiment, suggesting increasing buyer interest. On the other hand, if the price is rejected at the current resistance, the $0.43 zone is expected to provide support before any further significant downward movement. The overall uptrend remains valid as long as ENA continues to establish higher lows.
The Bottom Line on Ethena's Price Outlook
Ethena's chart is beginning to display a constructive pattern, but the immediate future of ENA's price hinges on the outcome at the 200-day moving average. A successful break above this level could signal the start of a substantial rally, potentially in the range of 10-15%. Failure to breach this resistance might necessitate a further market consolidation before such a move can occur.
Regardless of the short-term outcome, ENA is currently forming a structure that is generally favored by traders. If the anticipated breakout is confirmed, the next price targets could easily reach $0.55 or even $0.60 in the coming weeks.