

Sei is making significant behind-the-scenes advancements, securing integrations with major institutional players such as Apollo, Robinhood, and even BlackRock’s Kaiko. This indicates strong confidence in Sei as a fast settlement layer for real-world assets and on-chain finance. However, the current SEI price chart does not reflect this underlying momentum.
Analyst CryptoBusy has highlighted this unusual divergence between strong fundamentals and slow price action, suggesting that such gaps are typically short-lived and that a resolution is inevitable.
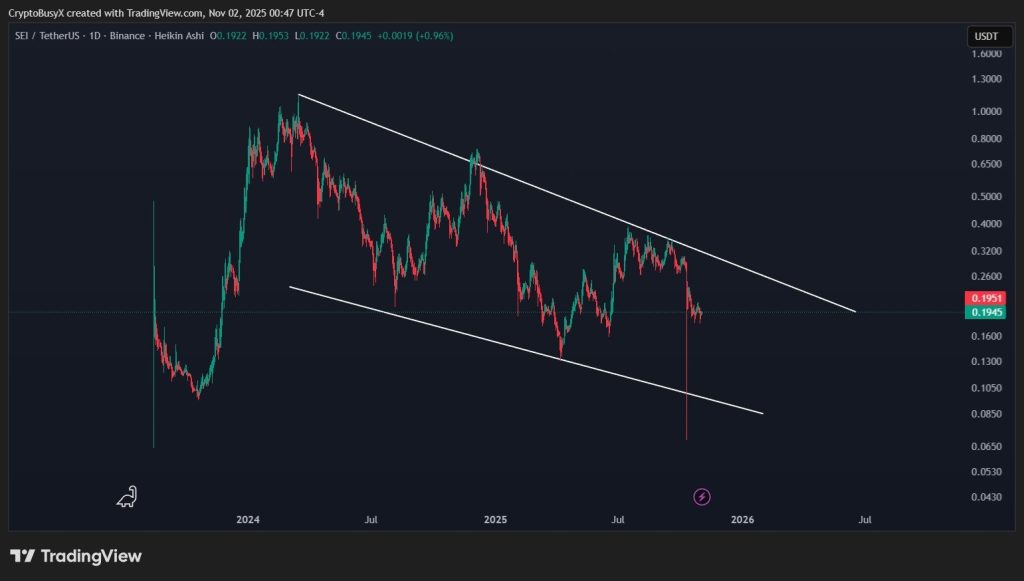
SEI Has Been Forming a Falling Wedge for Months
The daily chart reveals that the price of Sei has been consolidating within a long-term falling wedge formation. This pattern is characterized by buyers consistently entering at slightly higher prices with each successive dip, while sellers push the highs lower. This dynamic creates a gradual squeeze that will eventually lead to a breakout in one direction or the other.
Currently, Sei is positioned near the lower boundary of this wedge, around the $0.19 level. This area has historically served as a consistent support zone throughout the pattern, often attracting early buyers anticipating an upward move.
The SEI Breakout Area Is Clear
CryptoBusy has identified a key resistance zone that traders are closely watching: the area between $0.26 and $0.30. A decisive break above this range would signal a significant shift in market momentum.
Such a breakout would confirm the end of the current compression phase and suggest that buyers are prepared to drive a substantial recovery. This scenario is contingent on SEI's price successfully breaking through and holding above this critical resistance area.
There remains a risk of a breakdown. If Sei loses the lower trendline of the wedge, the pattern would be invalidated, likely delaying any significant recovery and allowing sellers to regain control. However, as long as Sei's price continues to bounce within the confines of the wedge, the setup remains technically intact.
How High Could Sei Go?
Should a breakout occur and be confirmed, the initial price target is projected around $0.40. This level previously saw significant trading volume before the recent downturn and represents a logical point for a relief rally to gravitate towards once bulls gain dominance.
A move back to this level would serve as a strong indicator that Sei is beginning to respond to its fundamental developments, rather than simply trading sideways.
Sei is currently in a compelling position. Institutional involvement is increasing, its utility continues to expand, and technically, the chart suggests the end of a prolonged consolidation phase is approaching. The critical question now is whether Sei's price can successfully flip the $0.26–$0.30 region into support. If buyers achieve this, the chart indicates a direct path toward a move to $0.40, with potential for further gains as momentum builds.