

Avantis (AVNT) token experienced a significant surge in September 2025, with its price climbing over 900% within two weeks, reaching $2.60 on September 22 from an initial price of $0.26. However, since this peak, the momentum has reversed, and the price of Avantis has dropped by over 70%. This analysis explores the reasons behind the sudden price decline and provides an outlook for the future of AVNT.
Why AVNT Price Is Down
The decline in AVNT's price is primarily attributed to weak market sentiment, profit-taking by investors, and a broader risk-off mood prevailing in the cryptocurrency market. The current Fear and Greed Index stands at 29, indicating a state of "Fear," which typically leads investors to avoid risky assets. Furthermore, Bitcoin's dominance has risen to 59.03%, suggesting that capital is flowing towards Bitcoin, causing altcoins like AVNT to lag behind. With a 30-day return of -72.77%, AVNT is significantly underperforming the market. The 30-day Exponential Moving Average (EMA) at $0.847 is now acting as resistance, and regaining this level would likely require a renewed sense of confidence in altcoins.
Following a rally of 44.69% on October 21, spurred by news of its $106.5 million Total Value Locked (TVL), traders quickly moved to secure their profits. The daily trading volume decreased by 17.87% to $474 million, signaling a cooling of momentum and a typical "buy the rumor, sell the news" reaction. Long-term holders are exhibiting caution after the steep monthly decline.
Adding to the downward pressure, the overall cryptocurrency market has experienced a decline of approximately 5% over the past week. Both Bitcoin's dominance and the Fear & Greed Index readings reflect a shift towards safer assets. Given its high 90-day volatility of 142%, AVNT is susceptible to sharper downside movements when investors become defensive, leading to its current struggle as capital rotates into Bitcoin.
Avantis Price Outlook and Indicator Readings
On the 4-hour chart, the AVNT price has been trading within a range between support at $0.46 and resistance at $0.75 since the crash on October 10. The price tested the $0.75 resistance level multiple times between October 19 and October 21, with each attempt encountering selling pressure. This repeated rejection explains the current range-bound trading pattern.
The Open Interest Market Cap Ratio, as measured by CoinAnk, indicates the level of leverage and open positions relative to the market size. This ratio has increased to approximately 0.43, suggesting that more traders are opening positions while the price remains relatively flat. While rising open interest can often precede a significant price move, it does not specify the direction of that move.
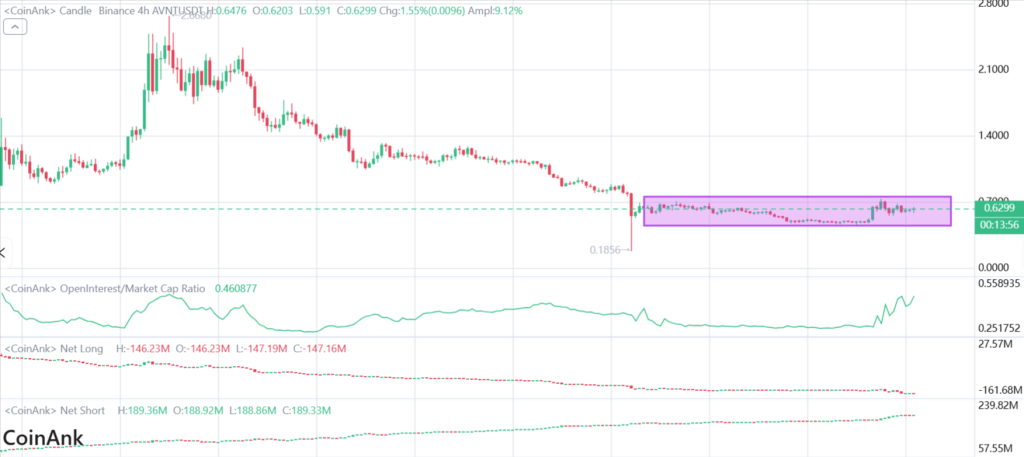
Net long positions track traders who are betting on higher prices. Currently, net longs are negative, standing near -146 million, which signals that the number of buyers is smaller than the number of sellers. This imbalance helps explain why rallies toward $0.75 have been unsuccessful. Net short positions, which represent traders betting on a price decrease, are near 188 million. This larger short exposure creates persistent downward pressure as traders await better confirmation to switch to long positions.
Trading volume provides insights into market conviction. The volume spike observed during the TVL announcement lacked sustained follow-through volume afterward. The subsequent drop in volume to $474 million indicates that buyers have stepped back, and sellers have utilized the spike to exit their positions. The combination of high short exposure and declining volume reduces the likelihood of a clean breakout unless new demand emerges.
Volatility metrics offer further context. AVNT's 90-day volatility is approximately 142%, meaning its price amplifies broader market movements. This high beta makes AVNT a quick mover in both directions and explains how a steep rise was followed by a steep fall within weeks.
Collectively, these indicators suggest a market that is building positions but currently leaning bearish.
Where Avantis Price Is Likely Headed Next
The price action on the 4-hour chart has established clear decision points. A sustained break above $0.75, accompanied by rising trading volume, increasing net long positions, and higher open interest, would signal a bullish shift. Such a scenario could potentially drive AVNT towards reclaiming higher resistance levels, including the 30-day EMA at $0.847, and potentially beyond if market risk appetite improves.
Conversely, a drop below $0.46, coupled with rising net short positions and stronger selling volume, would confirm the continuation of the downtrend. This move could lead to further erosion of gains, leaving AVNT searching for new, lower support levels.
The overall market environment will play a crucial role in determining the future direction of AVNT. With the Fear and Greed Index at 29 and Bitcoin's dominance on the rise, upward breakouts are currently more challenging. A swing back towards a risk-on sentiment would likely be necessary for Avantis token metrics to shift control to the bulls. Until such a shift occurs, the price may remain range-bound and volatile.