

BNB has experienced a cooling-off period following a volatile end to October. The current chart patterns suggest that a significant decision point for the BNB price is approaching soon.
Currently, BNB is trading around $1,085, reflecting a slight decrease in the latest 4-hour candle. While this represents a pullback, the broader market outlook remains contingent on the price action around the upcoming support levels.
BNB Rejected at $1,200 and Continues to Drift Lower
A few days ago, the BNB price attempted to surpass the $1,200 mark, but this upward momentum proved unsustainable. The rejection from the local high of $1,374 initiated a consistent downward trend, bringing the price uncomfortably close to the support zone just above $1,050.
If BNB can maintain its position above this critical area, the prevailing trend may see a recovery. However, a failure to hold the $1,050 support level could lead to a direct decline towards $1,000. Testing this round number could trigger increased fear within the market.
Current Indicators on the BNB Chart
The Relative Strength Index (RSI) is currently situated in the lower 40s. This indicates a waning momentum among buyers, though the market has not yet reached oversold conditions to prompt a strong rebound. This position represents an uncertain zone where various outcomes are possible.
The Moving Average Convergence Divergence (MACD) also signals a bearish sentiment. The red bars are widening again, while the signal line remains above, suggesting that sellers currently hold the advantage.
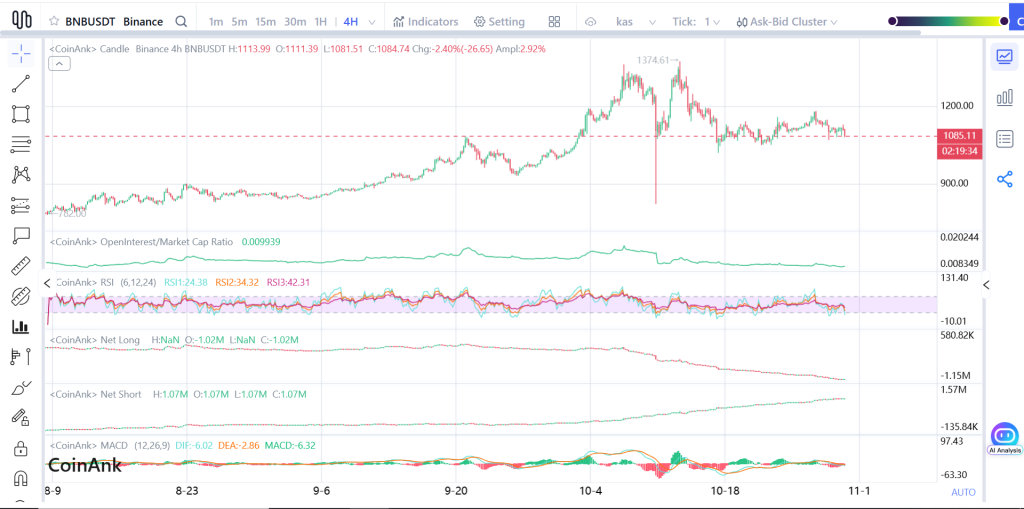
Furthermore, BNB's net long positioning continues to decline. Traders are actively closing their long positions rather than initiating new ones, which typically points to a lack of confidence rather than a strategic leverage shakeout.
Open interest has not increased during this price drop, indicating neither a significant build-up of short positions nor aggressive buying at lower levels. The market appears to be in a state of caution, with participants awaiting a clear directional signal.
In essence, the market is paused, awaiting a breakout or breakdown that will force a definitive move.
Potential Future Movements for BNB Price
Should BNB price successfully reclaim the $1,200 level, market sentiment is likely to shift rapidly. Traders would then begin targeting a renewed attempt at the $1,374 resistance. If this level is decisively broken, the $1,500 mark could become a target for November.
Conversely, if the support at $1,050 fails to hold, a swift decline towards $1,000 is possible. Below this level, the market momentum could turn significantly more bearish than current bullish sentiment might suggest.
BNB Faces a Critical November Juncture
BNB has demonstrated strong performance for most of the current year. However, the market is now seeking confirmation that buyer interest remains robust. Holding the current support levels is crucial for maintaining the existing trend. A breakdown below these levels would signal a shift towards a lower price structure.
This period represents a moment of palpable tension in the market. The BNB chart is unlikely to remain stagnant for an extended duration.
The upcoming month of November will reveal whether BNB is preparing for another upward movement or if the current cooldown phase has further to extend. Regardless of the direction, the next significant price action is anticipated to occur imminently.