

Hyperliquid’s HYPE token is entering a critical phase on the charts, with price action retesting a major breakdown area while momentum indicators show weakening confidence across the market.
The token is currently trading at $34.81, hovering just below its 50-day SMA at $39.73 and sitting tight against the 200-day SMA at $36.32, a setup that often signals indecision before a decisive move. Sentiment remains firmly bearish, while the Fear & Greed Index reads 22, reflecting continued stress among traders despite a resilient stretch of green days this month. The asset’s high 10.71% volatility reinforces the likelihood of a volatile next move as the market recalibrates expectations following recent breakdown patterns.
Analyst Chart Points to a Classic Head-and-Shoulders Breakdown
A chart shared by analyst Ali highlights a clearly structured head-and-shoulders pattern, with the left shoulder forming in early July, the head peaking in September above the $55 region, and the right shoulder forming in October. The neckline sits just under the $37 zone, which HYPE has already broken below.
Hyperliquid $HYPE is retesting the breakdown zone before a potential move toward $25. pic.twitter.com/SfnMFX4DWz
— Ali (@ali_charts) November 27, 2025
Price is now retesting this neckline from underneath, a textbook bearish retest that often precedes continuation to the downside. Ali’s projection shows multiple potential paths lower, including short-term choppy recovery attempts followed by a sustained drop toward the $25 region, which aligns with the next major support zone on the visual chart.
This structure suggests that the recent bounce is not reversal strength but rather a liquidity retest, as price interacts again with the level it broke down from. If HYPE fails to recover above this neckline convincingly, sellers are likely to regain control and drive the market toward the thicker support bands mapped around $29, $26, and eventually $25.
Market Data Shows a Market Under Pressure
On shorter timeframes, the TradingView chart confirms the broader weakness. The last several days show repeated failed attempts to sustain momentum above the mid-$35 range, followed by lower highs that align with the bearish bias. Although intraday volatility has pushed price as high as $36, each move has been met with selling pressure. The chart also shows periods of strong pullbacks near $33 and $31, highlighting that the market has not developed meaningful new buying interest despite the recent fluctuations.
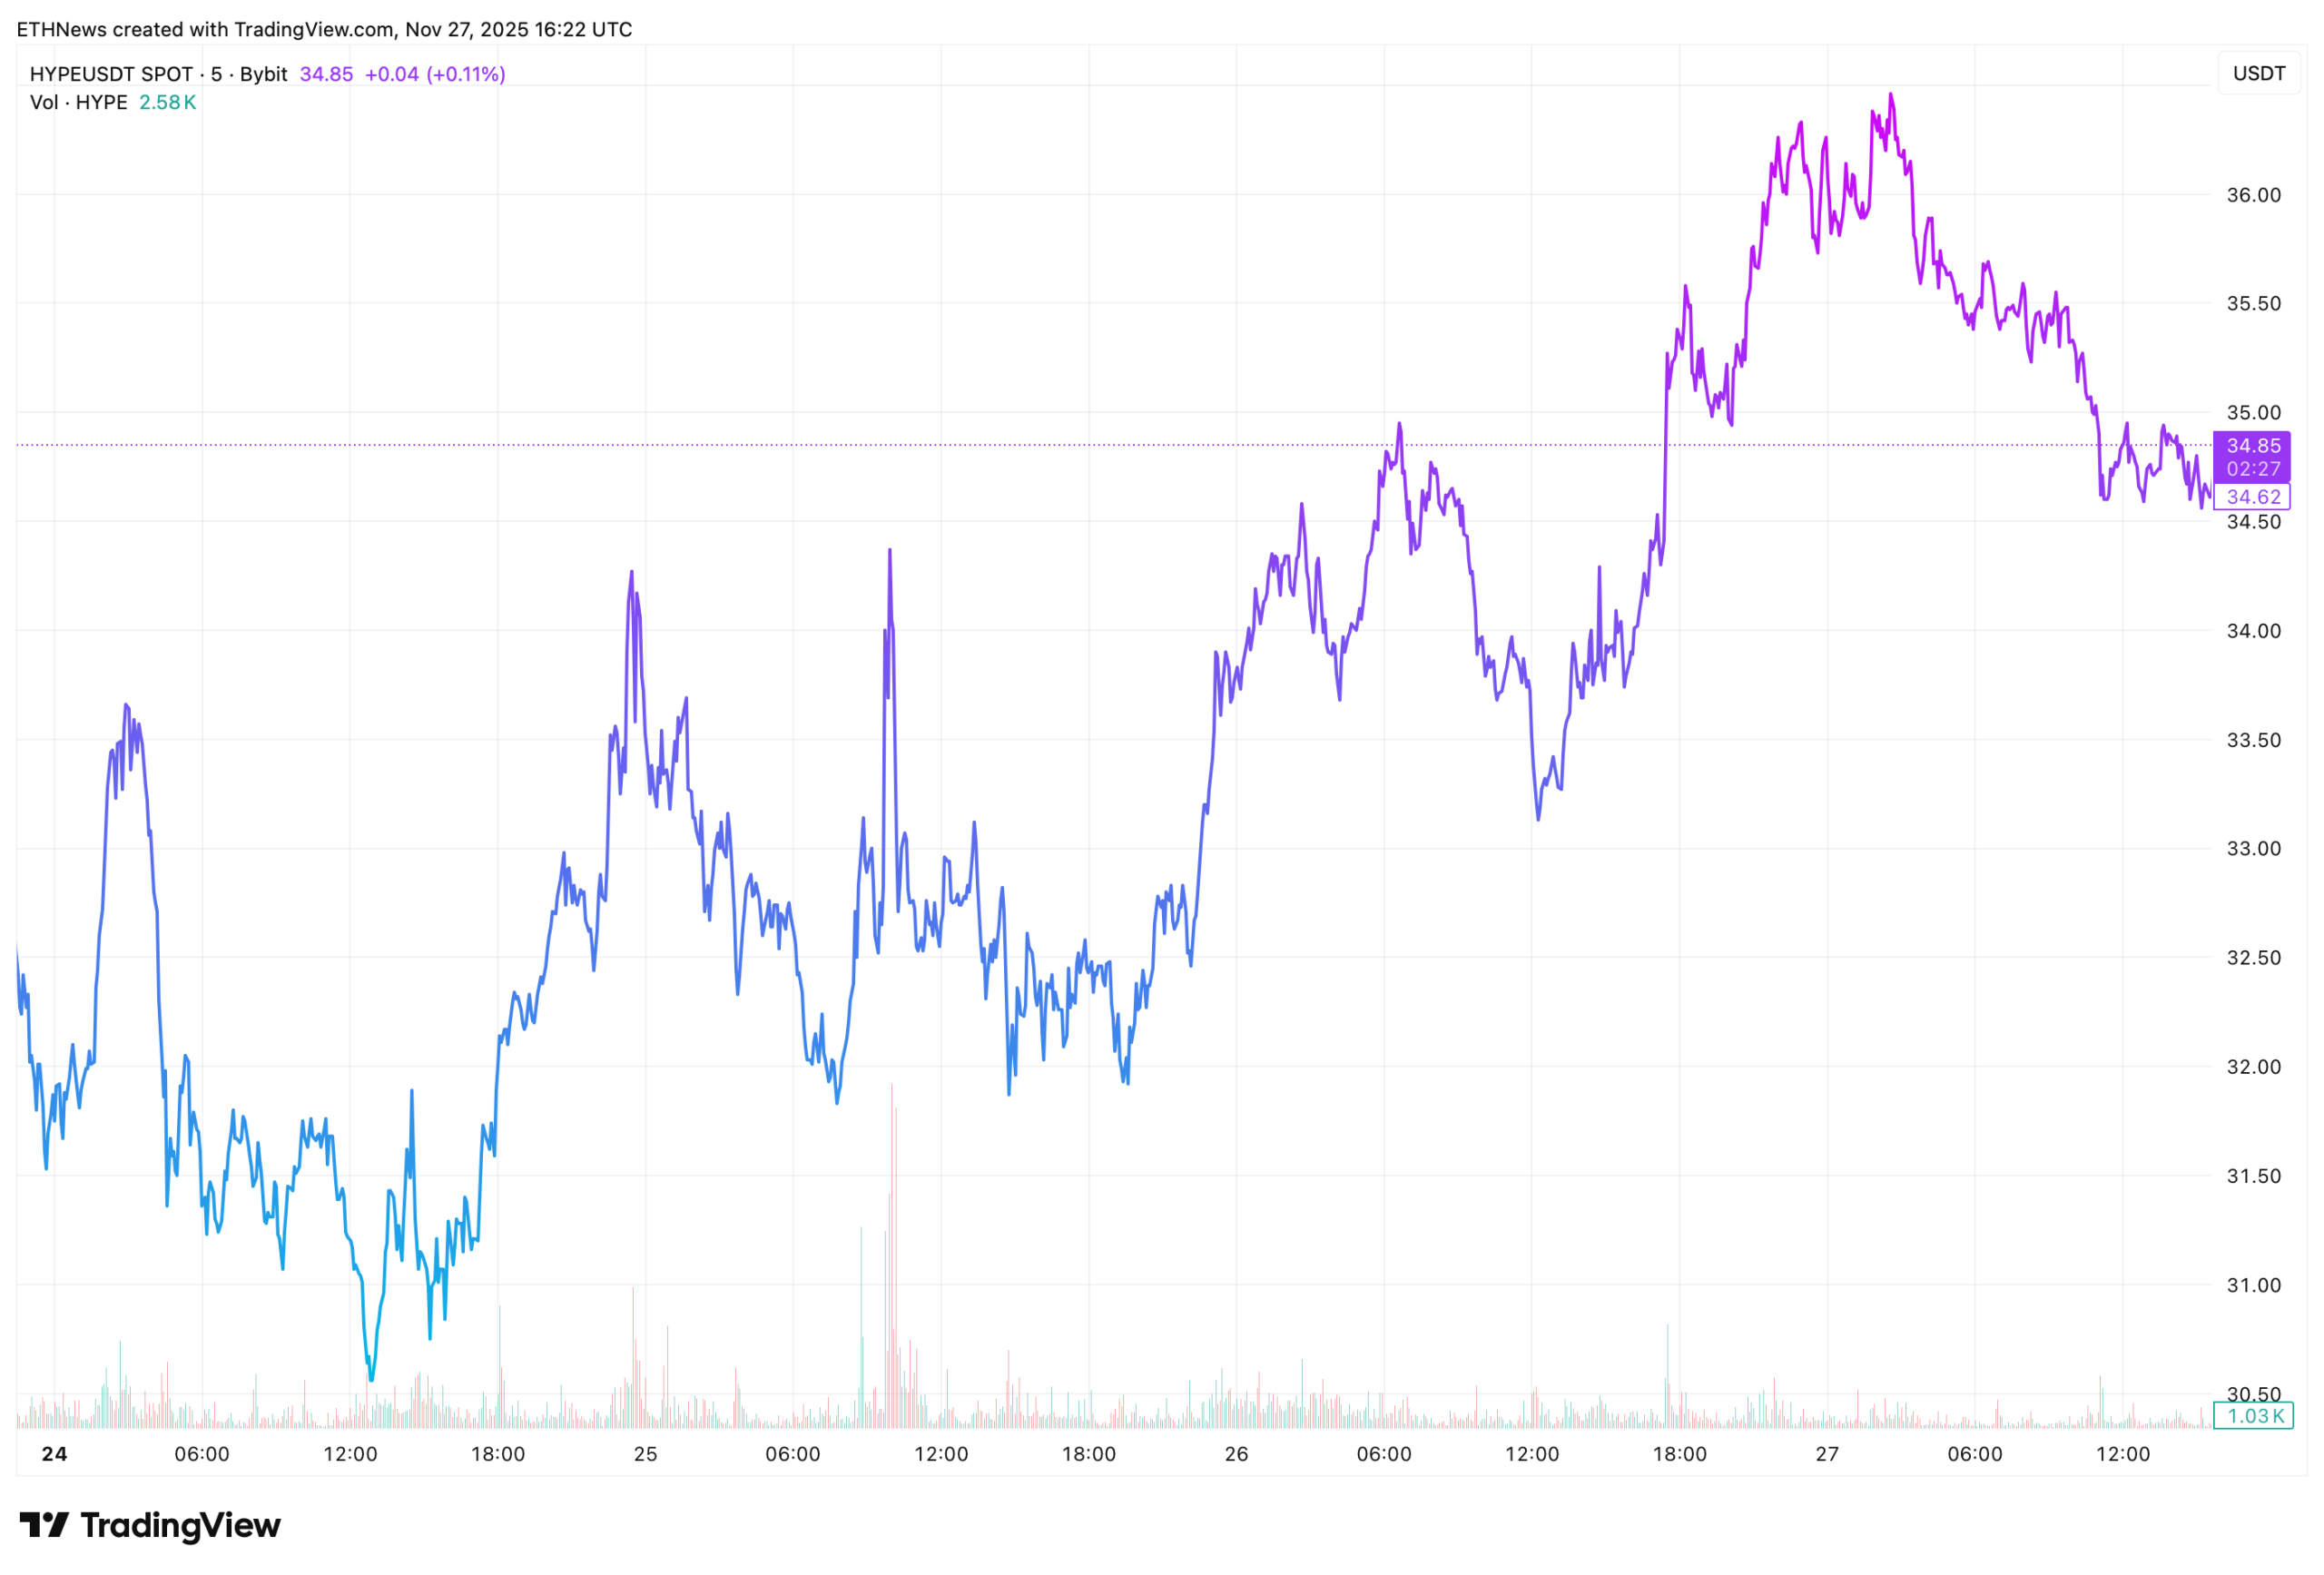
The RSI at 47.34 reflects neutral momentum, but its failure to push into bullish territory supports the idea that the current move upward is corrective rather than trend-shifting. With both short- and long-term SMAs positioned above the current price, HYPE remains technically below its key trend zones.
A Market Waiting for Confirmation
Until HYPE can reclaim the neckline area with strong volume and hold above the major moving averages, the dominant narrative remains downward, in line with the head-and-shoulders structure and the bearish sentiment metrics.
Traders watching this move will pay close attention to whether price breaks under recent local lows, which would open the road toward the projected $25 target. At the same time, the market’s high volatility and frequent intraday rallies show that the path lower might not be a straight line but a series of attempts to reclaim resistance before the next leg down.
For now, the market sits at a decisive moment: reclaim the neckline and neutralize the breakdown, or reject at resistance and validate the bearish setup that has been building for months.