

Hyperliquid's HYPE token is entering a technically sensitive phase, with fresh chart action confirming a pattern highlighted by analyst Ali Martinez. The latest price movements suggest that a larger rounding-top structure has continued to form, hinting at a possible shift in momentum as the market loses strength near the upper curve of the formation.
A Clear Rounding-Top Structure Takes Shape
Ali's chart outlines a broad, months-long rounding top that began forming after HYPE’s strong surge in mid-year. The curve shows a gradual loss of upside momentum, with each rally weakening as price bends downward along the arc. The support line underneath the pattern is the critical trigger: a firm breakdown below that level would complete the formation and open the door for a deeper correction.
A rounding top appears to be forming on Hyperliquid $HYPE, suggesting a potential move toward $16. pic.twitter.com/HfZO0mEYdV
— Ali (@ali_charts) December 6, 2025
The tweet highlights a potential downside target near $16, which aligns with the lower extension of the projected move once the support area is lost.
Short-Term Chart Confirms Selling Pressure
The 2-hour TradingView chart reinforces the weakness. HYPE recently printed a sharp red candle that pushed the price to around $29.50, extending the multi-day downtrend that followed the last failed rebound earlier in the week.
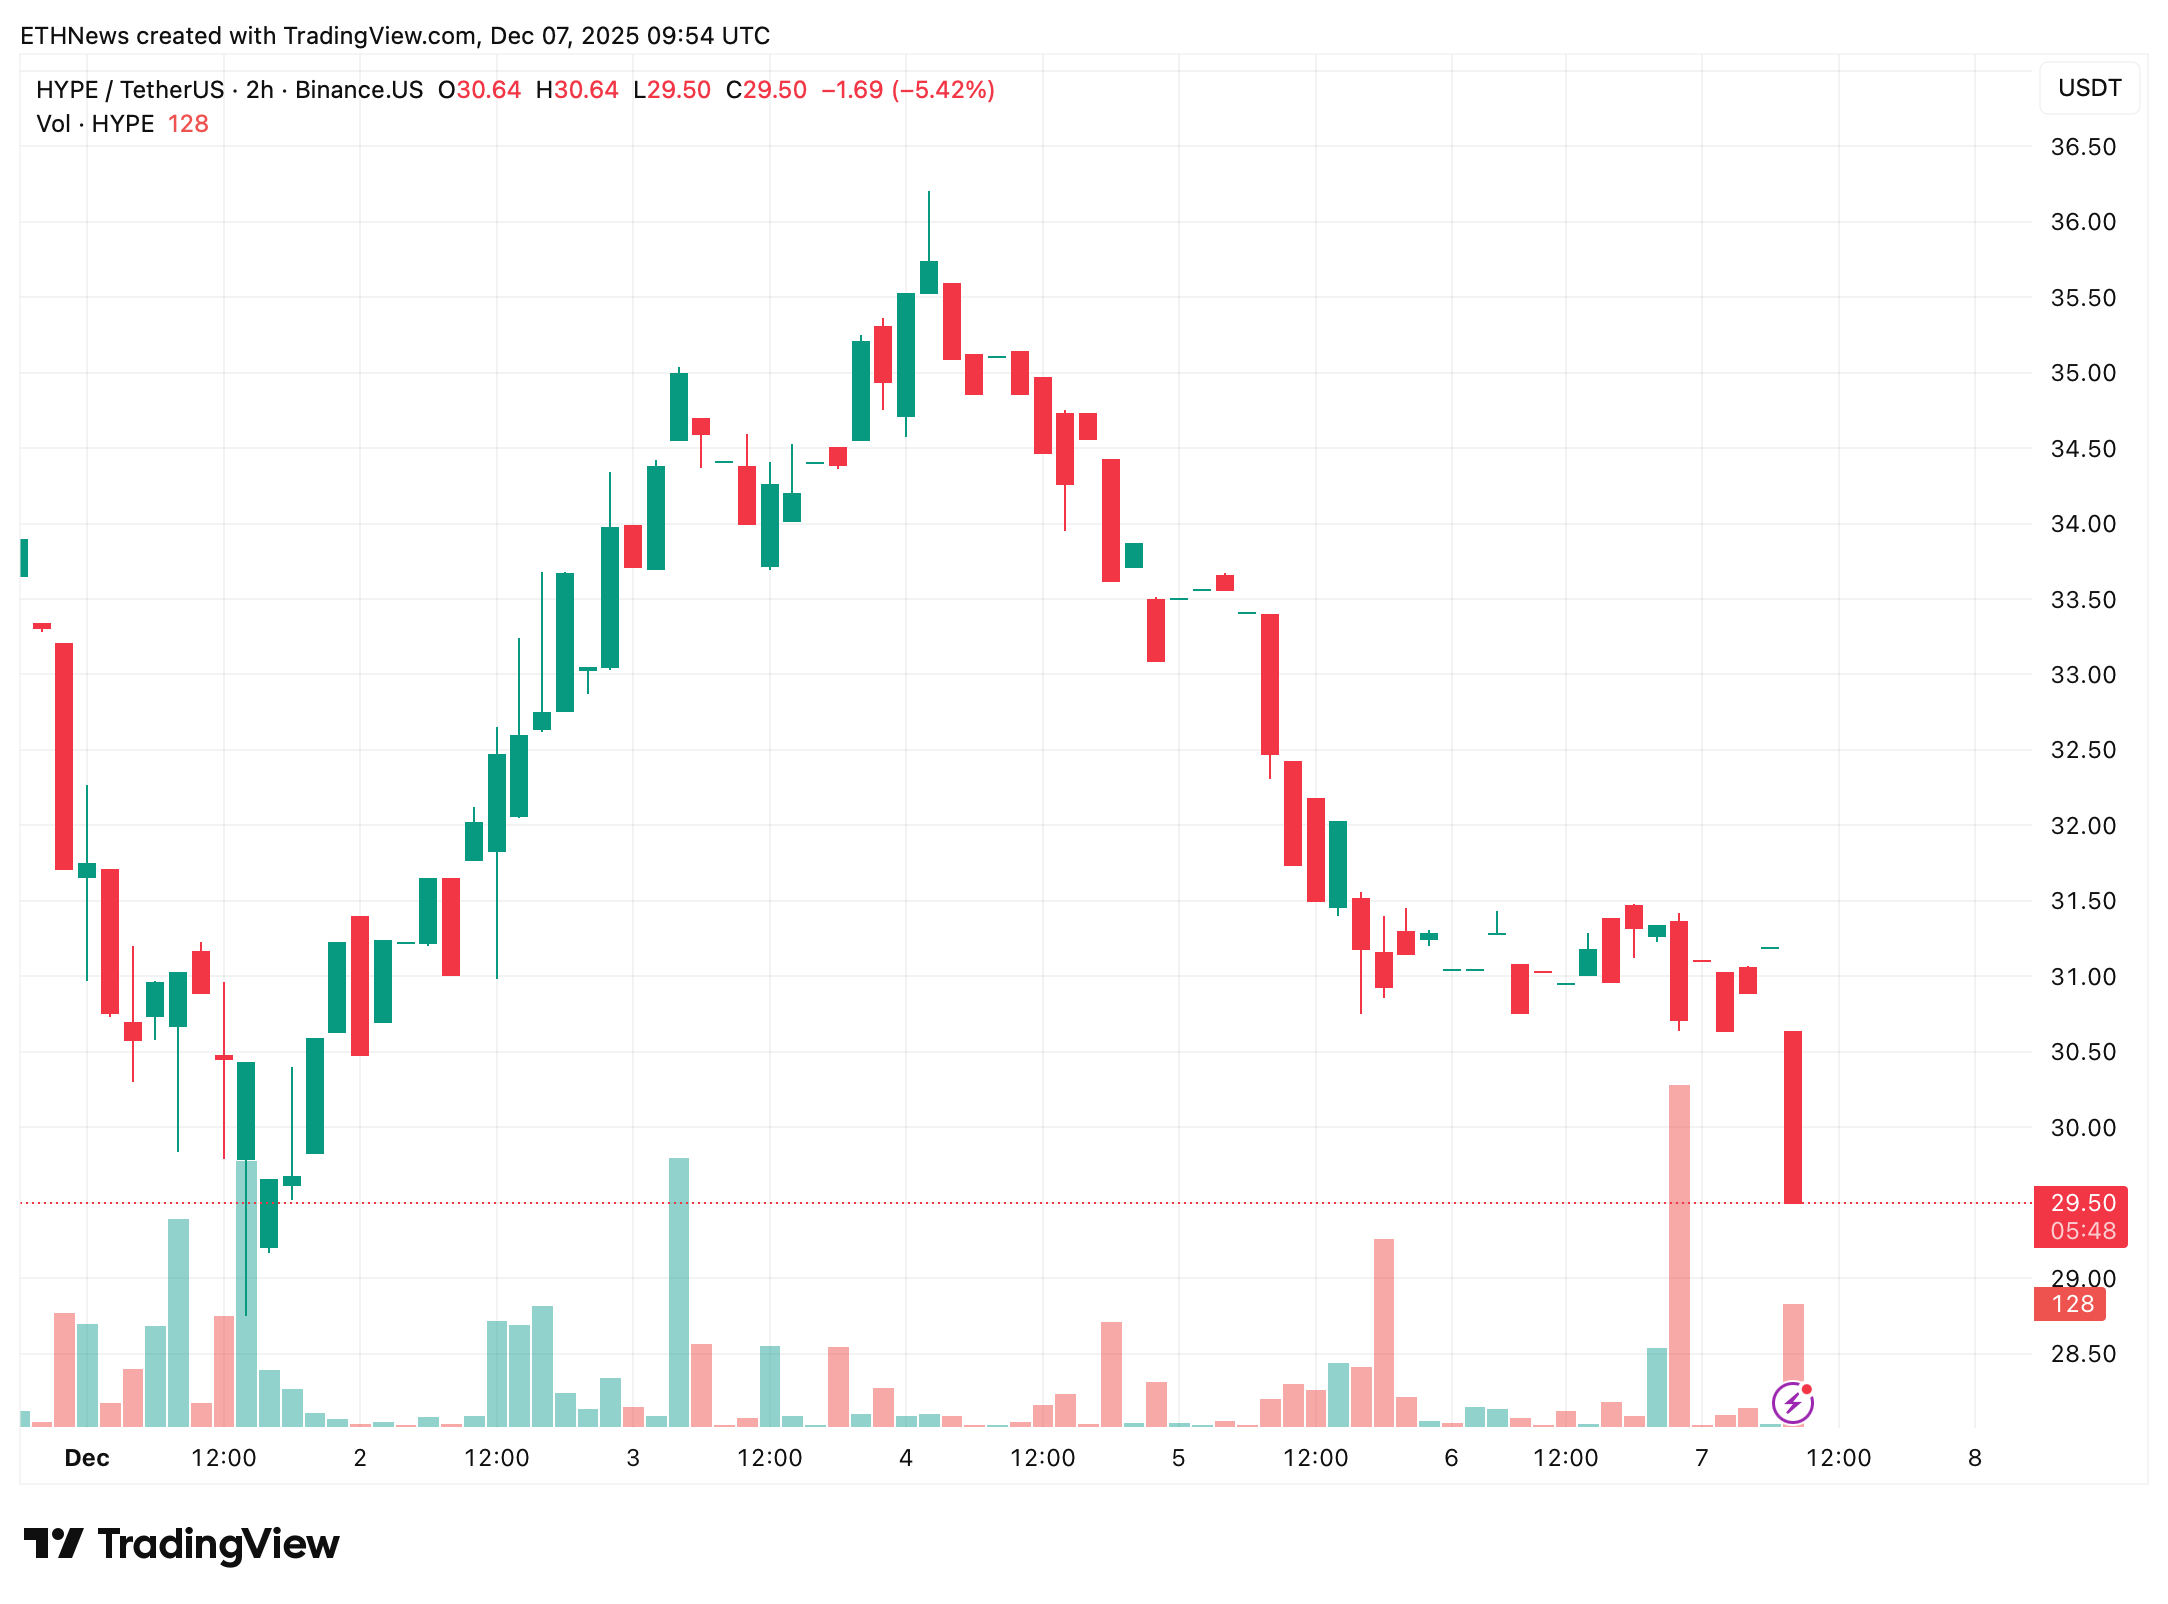
The structure remains clearly bearish, marked by:
- •Lower highs forming across December
- •Consistent sell-volume spikes during declines
- •A steady loss of momentum each time the price attempts a bounce
This short-term behavior fits neatly within the broader rounding-top structure, where rallies become noticeably weaker as the pattern matures.
What Happens Next
If the price continues sliding along the lower boundary of the formation, the decisive moment will come at the horizontal support area highlighted in Ali’s chart. A clean break would validate the full rounding-top pattern and could accelerate a move toward the $20–$16 region, depending on the velocity of the sell-off.
On the other hand, if buyers manage to defend support and reclaim the mid-arc region, the pattern could lose validity, but at this stage, the charts show no clear signs of sustained reversal strength.