

Bitcoin's recent pullback has sparked discussions about whether the market has reached its lowest point. Current on-chain metrics and price action suggest that there may be further room for decline.
A significant indicator used by traders to track losses has not yet reached levels that have historically marked previous market lows.
On-Chain Losses Indicate Potential for Further Decline
Crypto analyst Ali Martinez highlights a historical pattern based on realized losses. Historically, when the average unrealized loss for short-term holders, defined as coins held for one to three months, drops below -37%, it has often signaled strong entry points for the market.
Some of the best buy-the-dip opportunities have appeared when Bitcoin $BTC on-chain trader realized loss drops below -37%.
Right now, it’s at -18%. pic.twitter.com/k5rys0yip5
— Ali (@alicharts) December 11, 2025
As of December 8, these short-term holders are experiencing an average loss of 18% on their positions. While this indicates significant market pain, this level is considerably lower than what has been observed at past market bottoms. Bitcoin is also currently trading below its realized price, which is approximately $112,300. At the time of this report, the cryptocurrency is trading near $90,400, indicating that a substantial number of traders are currently operating at a loss.
Significant drops exceeding 37% previously occurred in early 2020, mid-2022, and late 2023. In each of these instances, the market subsequently experienced a reversal and moved higher.
Price Declines Following Federal Reserve Meeting
Bitcoin experienced a decline after the US Federal Reserve concluded its December policy meeting. The Fed announced a rate cut of 0.25%, and Chair Jerome Powell indicated that further cuts could occur in 2026.
The current weekly loss for Bitcoin exceeds 3%, with a 24-hour decline of over 2%. Over the past 24 hours, the price has traded within a broad range between $89,623 and $94,177, according to CoinGecko data. The most recent high was recorded at $126,080 in early October, meaning the market has fallen more than 28% from that peak.
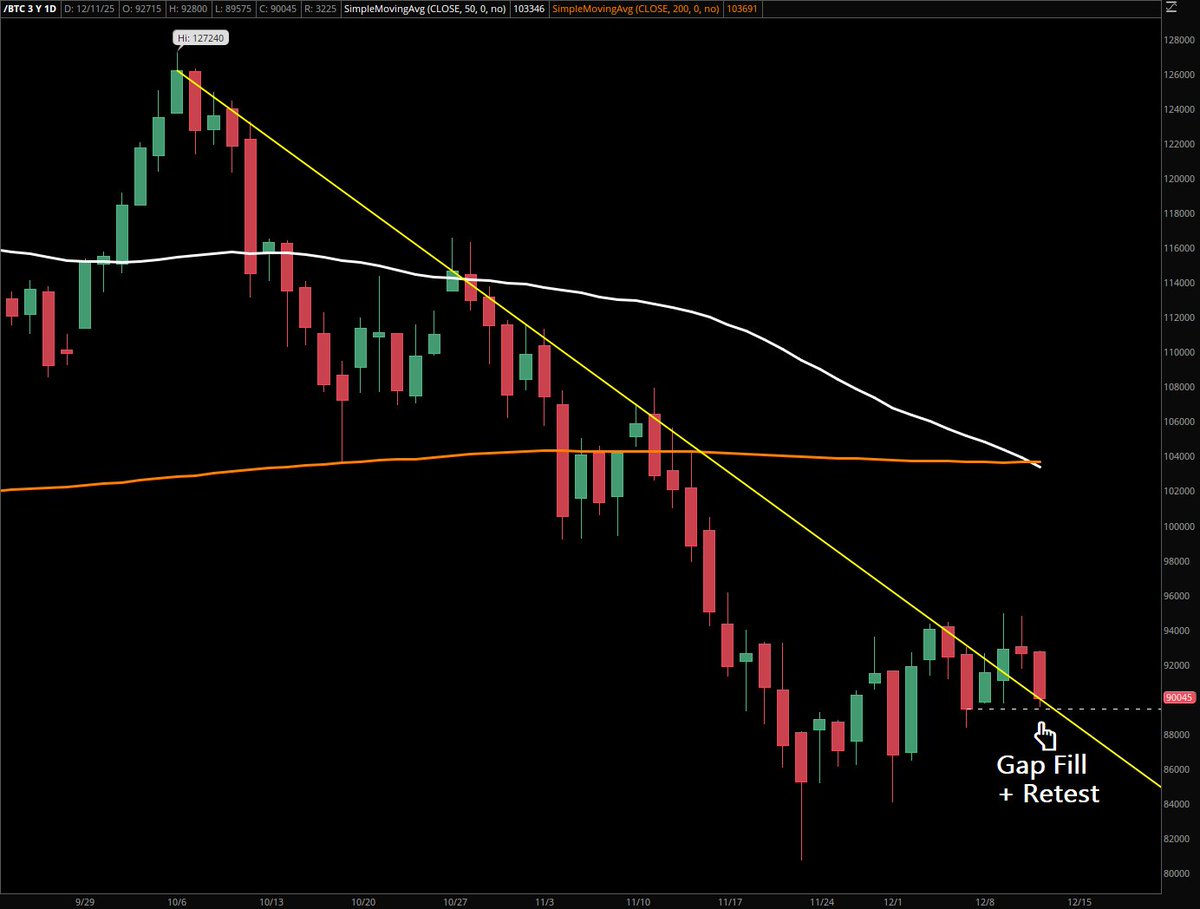
Furthermore, Bitcoin futures on the CME have retested a significant trendline. After breaking out of a linear downtrend, the price has now returned to the breakout zone, as reported by Super฿ro. This type of retest is frequently monitored by traders seeking confirmation of a trend shift.
Concurrently, the 50-day moving average has crossed below the 200-day moving average, a pattern known as a "death cross." This marks the first death cross on CME futures since 2022. While this signal is not always a definitive predictor on its own, many traders utilize it to identify trend shifts or confirm market weakness.
Traders Observing Key Zones for Directional Cues
Analyst CRYPTOWZRD noted that Bitcoin's daily candle closed without establishing a clear directional bias. A sustained break and hold above the $94,000 level would support an upward movement. Conversely, a price falling below $89,250 would indicate continued weakness in the chart.
The current price action is confined within a narrow range. Until a decisive breakout occurs, traders are maintaining patience and looking for more robust setups on lower time frames.
In parallel, open interest in Bitcoin futures has seen a sharp decrease. According to Ali, the total open interest has fallen from $47.5 billion to $27.5 billion within the last two months. This reduction in open interest suggests a general decrease in market exposure across the board.