
Ethereum (ETH) has experienced a significant pullback in recent days, declining by 14% over the past week. Despite this downward movement, analysts suggest that the recent breakdown might not signify weakness but could instead pave the way for the next major upward surge. At press time, the asset is trading around $3,390, having gained 2% in the last 24 hours.
Certain technical analysts continue to highlight long-term chart structures and liquidation setups that support the potential for a bullish continuation.
Pattern Suggests Breakdown Could Precede Breakout
Trader Tardigrade shared a multi-cycle perspective on Ethereum’s price action using the 3-day chart. This analysis indicates that ETH has historically entered strong uptrends following breakdowns from support levels. These breakdowns were subsequently followed by consolidation periods within sideways ranges, which then led to significant breakouts.
The current price action suggests that ETH may be replicating this pattern. Tardigrade commented on the potential implications, stating:
$ETH/3-day
A breakdown is essential for a massive surge 🔥#Ethereumpic.twitter.com/jMexdye4bg— Trader Tardigrade (@TATrader_Alan) November 6, 2025
Based on this observed pattern, ETH appears to be in the process of building a base that could precede further upward movement.
Long-Term Structure Remains in Place
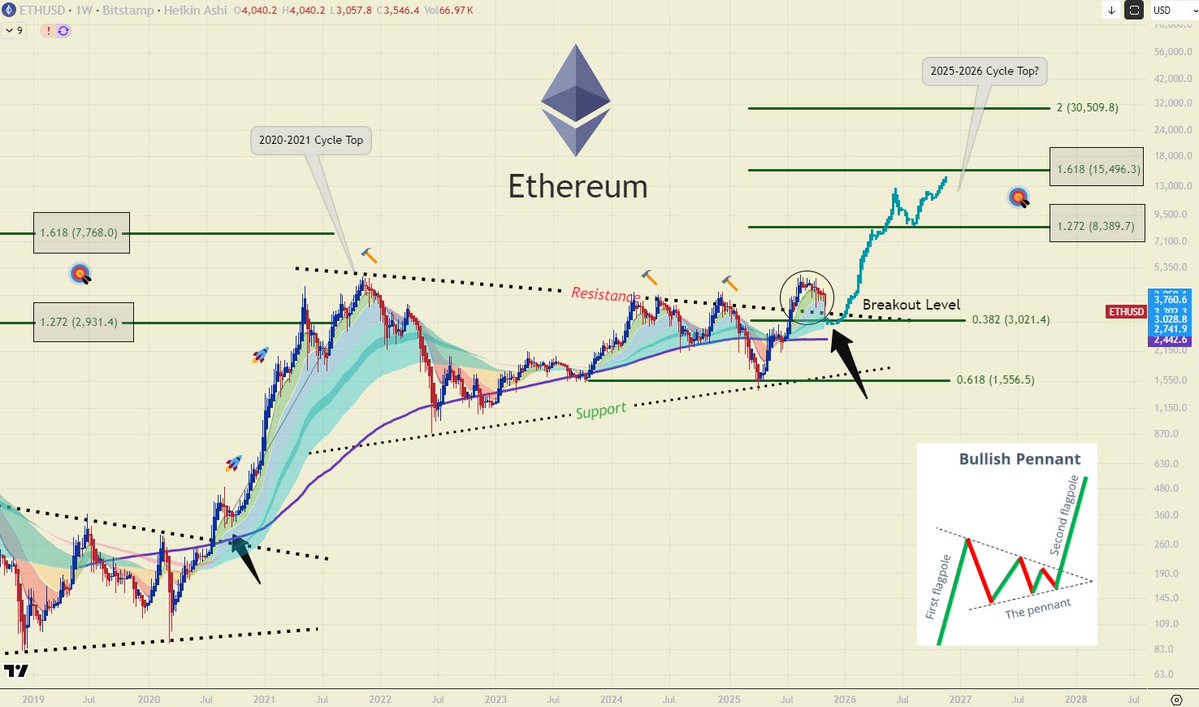
Another market analyst, BACH, pointed to a long-term bullish pennant formation that remains intact on the weekly chart. Ethereum recently managed to reclaim the $3,000 breakout level, which corresponds with the 0.382 Fibonacci retracement of the previous cycle. This specific area is being closely monitored as a potential support zone.
Projections based on Fibonacci extensions suggest future price targets of $7,700, $15,500, and $30,500, with a potential macro top anticipated between 2025 and 2026. BACH commented on the current market sentiment, noting that “Crypto sentiment [is] completely washed out and in Extreme Fear,” a condition historically observed near market bottom ranges.
Short-Term Levels and Leverage Signals
Analyst Lennaert Snyder noted that ETH needs to hold the $3,300 level to maintain a pattern of higher lows. He also emphasized the importance of reclaiming the $3,530 level.
“If we lose $3,300 with conviction I’m shorting the continuation to probably new lows,” he stated.
Liquidation data indicates a concentration of short positions between $3,500 and $3,800. A price increase in this range could trigger forced liquidations, potentially accelerating the upward movement. CryptoGoos commented on this risk for short traders, stating, “MAX PAIN IS UP FOR $ETH.”
Despite the recent recovery, ETH has faced challenges in reclaiming the $3,600–$3,700 zone. Analyst Ted suggested that the bounce was primarily driven by the closure of short positions.
“Until Ethereum reclaims the $3,600–$3,700 zone with strong inflows, the chances are it’ll go lower,” he observed.
As previously reported, the Taker Buy-Sell Ratio on Binance has remained below 1.0, indicating a greater volume of sell orders compared to buy orders. This data aligns with the broader observation of increased selling pressure, even as buyers cautiously await signs of a reversal.