

Bitcoin is currently trading near $103,500, having experienced a 2% decrease in the last 24 hours. While it remains slightly higher on a weekly basis, traders are closely observing a critical technical level: the 365-day moving average. This average has historically provided support for price during previous rallies and is presently being tested.
The 365-day moving average has proven to be a reliable support during earlier phases of the current market cycle. In multiple instances, Bitcoin has bounced off this level and subsequently achieved significant gains. Notable rebounds from this line have included price increases of over 190%, 124%, and 65% during previous stages of the ongoing uptrend.
However, in mid-2022, Bitcoin was unable to sustain this level. According to data shared by Satoshi Stacker, when this support was breached, the price declined by approximately 66% before finding a bottom. This historical data indicates that while the moving average can serve as a base during upward trends, a break below it can signal a shift in momentum towards a downtrend.
Bitcoin is testing the 365 day moving average. This level has supported $BTC throughout the bull market and previous bounces from it turned into major new uptrends. However, the last time BTC fell below this level, it dropped -66% before bottoming. pic.twitter.com/qhBzjVLtZT
— Satoshi Stacker (@StackerSatoshi) November 12, 2025
The current price is positioned just above this average, and a decisive move in either direction could provide insight into the market's next significant movement.
Historical Cycle Patterns Suggest Ongoing Correction
Analysis of past Bitcoin market cycles reveals a recurring pattern: a multi-year rally followed by a year-long decline. According to available market data, each major cycle has historically topped out approximately 1,064 days after its bottom. The most recent peak, observed near $126,000, also occurred 1,064 days after the low recorded in November 2022.
Analyst Ali Martinez commented on this trend, stating:
“If this Bitcoin $BTC cycle mirrors 2015–2018 or 2018–2022, the top was on Oct 26, and a macro downtrend may have already begun.”
Based on this historical model, a potential bottom could form around October 2026, with an estimated target range between $38,000 and $50,000. Previous price declines, ranging from 77% to 84%, lend support to this outlook.
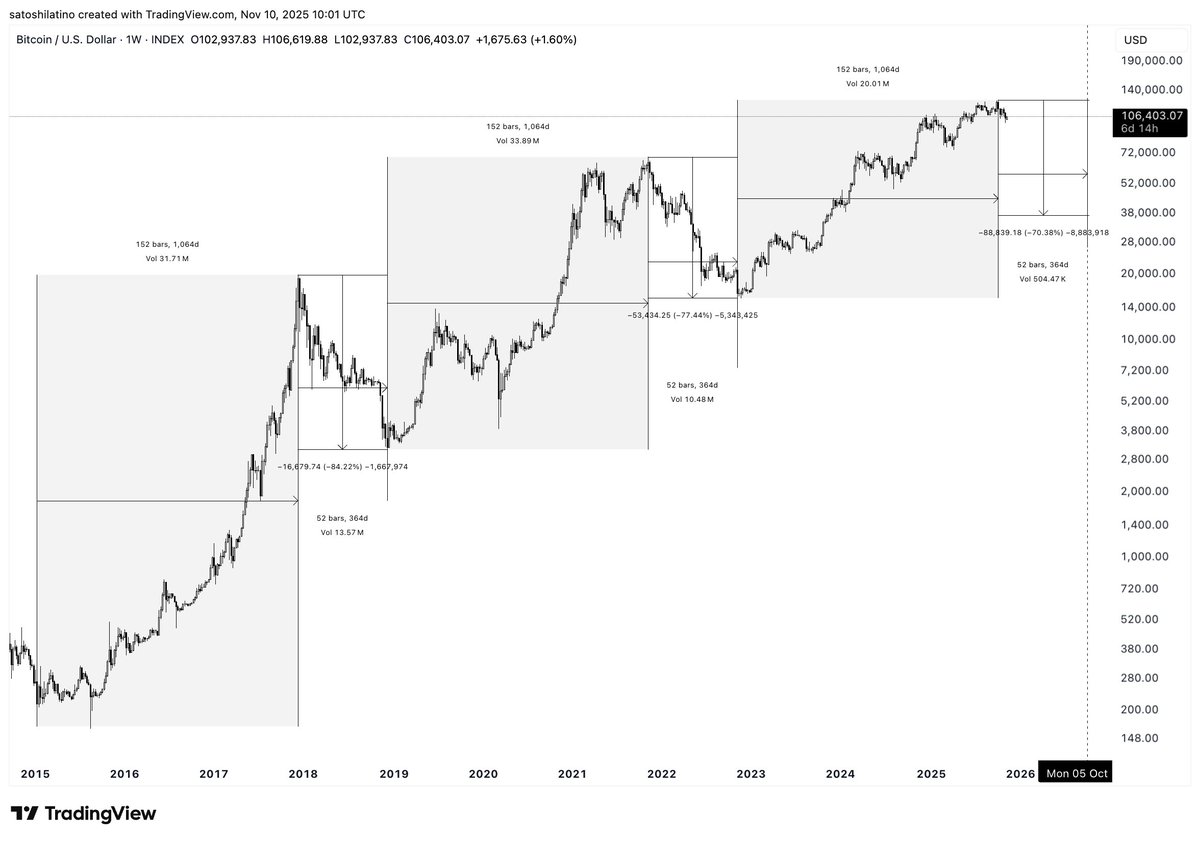
The recent price action and the timing of the market high are consistent with patterns observed in earlier cycles, reinforcing the possibility that Bitcoin may be entering the initial phase of a more extended correction.
Furthermore, Bitcoin's short-term and long-term moving averages are approaching a Death Cross. While this technical indicator is often viewed negatively, it has not consistently led to deeper price drops during this cycle. In many instances, Death Crosses have been followed by Golden Crosses as the market has subsequently recovered.
More Crypto Online highlighted the timing of these signals, noting:
“Almost every Death Cross in this cycle was followed by a Golden Cross later.”
This observation suggests that these indicators may be more valuable for providing context rather than precise future predictions.
Resistance Levels Cap Price Gains
Bitcoin experienced a brief rally following significant political developments in the United States, including a proposed tariff dividend announced by President Trump. This event drew parallels to earlier stimulus policies that preceded substantial gains in risk assets.
Concurrently, BTC is facing challenges in surpassing resistance levels situated between $107,000 and $118,000. As previously reported, selling pressure from long-term holders, combined with broader macroeconomic concerns, is creating a ceiling in this price zone, limiting Bitcoin's short-term upward potential.