

JASMY Price Holds at $0.00739 Amid Bearish Trend and Reversal Hopes
JASMY Trades Near Support With Weak Momentum
JASMY has been trading in a bearish range, currently priced at $0.00739 as of November 29, 2025. Despite ongoing pressure, recent chart structures hint at a possible reversal. Analysts now point to key technical patterns that could trigger a breakout.
JASMY is trading at $0.00739 with a modest daily increase of 0.41%. The asset continues to move in a downward trend, with the price closely hugging the lower Bollinger Band at $0.00648. The middle band is positioned at $0.00808, and the upper band stands at $0.00968.
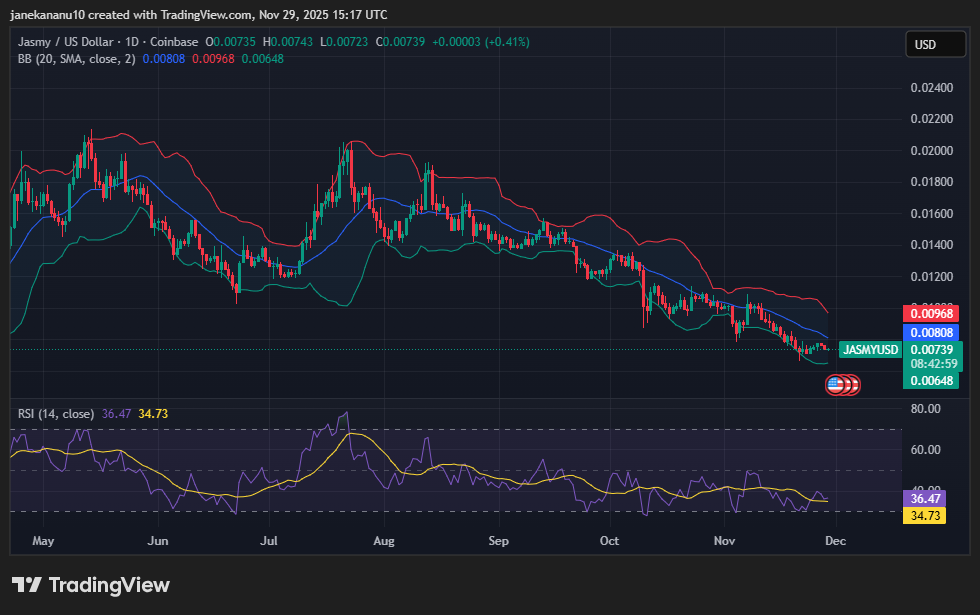
The Bollinger Band squeeze suggests low market volatility, while the Relative Strength Index (RSI) at 36.47 reflects weak buying momentum. The RSI moving average is slightly lower at 34.73, indicating that the token remains near the oversold zone. Despite the bearish trend, the price seems to be consolidating at a key support level.
Analysts Identify Bullish Reversal Patterns
Earlier this week, analyst Jasmybulls shared a technical chart outlining an inverse head and shoulders pattern for JASMY. The structure shows a Left Shoulder, Head, and Right Shoulder formation.
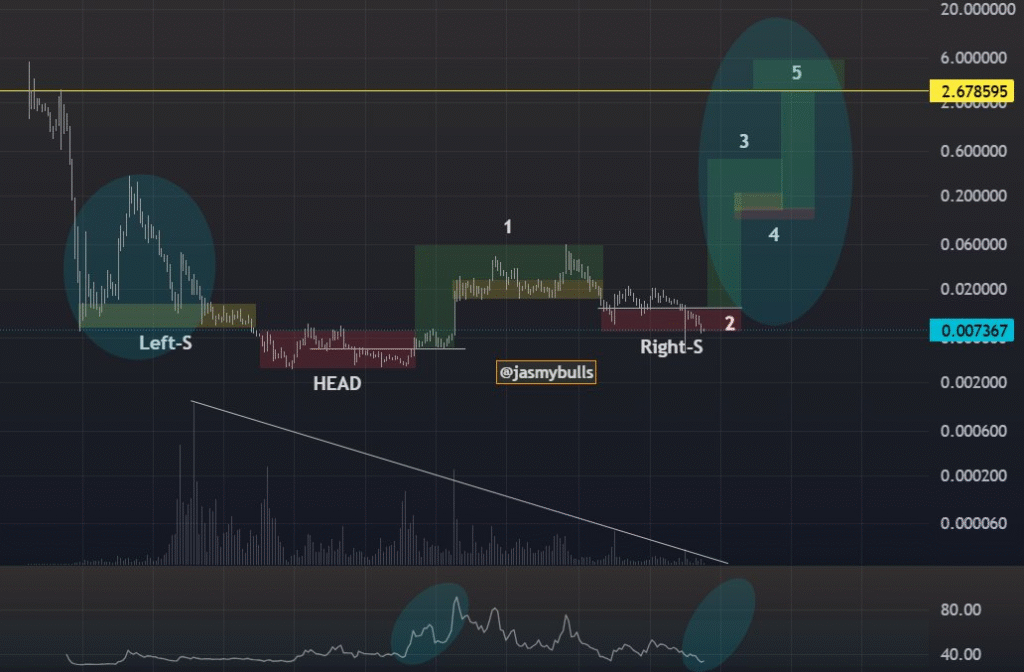
The chart also outlines five projected phases in an upward trend, with a possible long-term target of $2.678595. However, volume remains low, which often precedes a breakout in such technical setups. The pattern suggests that if the price breaks above the neckline, an upward trend may begin.
Two days later, JavonTM1 presented a similar pattern. The chart shows phases repeating in reverse, aligning with the inverse head and shoulders setup.
“Every phase looks to be repeating in reverse for JASMY,” the analyst stated, suggesting a consistent structural formation across multiple timeframes.