

Kaspa has broken out of its multi-week slump, experiencing a significant surge of over 25% in a single day and reclaiming the $0.05 level for the first time since the November market downturn. This recovery marks a notable shift after a period of declining confidence across the broader market.
Analyst Alex identified a favorable setup on X, highlighting a confluence of technical exhaustion, structural support, and wedge compression, all indicators that often precede substantial market reversals.
A closer examination of the chart reveals the basis for this optimistic outlook. Kaspa has spent a considerable portion of the past year consolidating within a large falling wedge, a chart pattern that typically signifies a gradual weakening of selling pressure over time. The current price action is occurring after a remarkable 535% rally that originated from the very zone the price is now retesting. This historical significance underscores the importance of the current support level, representing the origin point of the last exponential price increase.
Alex's analysis points out that the current support zone is precisely where KAS initiated its last parabolic ascent. Following an extended period of consolidation, markets often see an exit of less patient participants. During such phases, price may drift, trading volume can decrease, and market sentiment can reach its lowest point. Holders who continue to sell during these periods are often doing so out of disinterest rather than genuine panic.
This scenario accurately describes Kaspa's recent market behavior, until today's breakout injected renewed vitality into the asset.
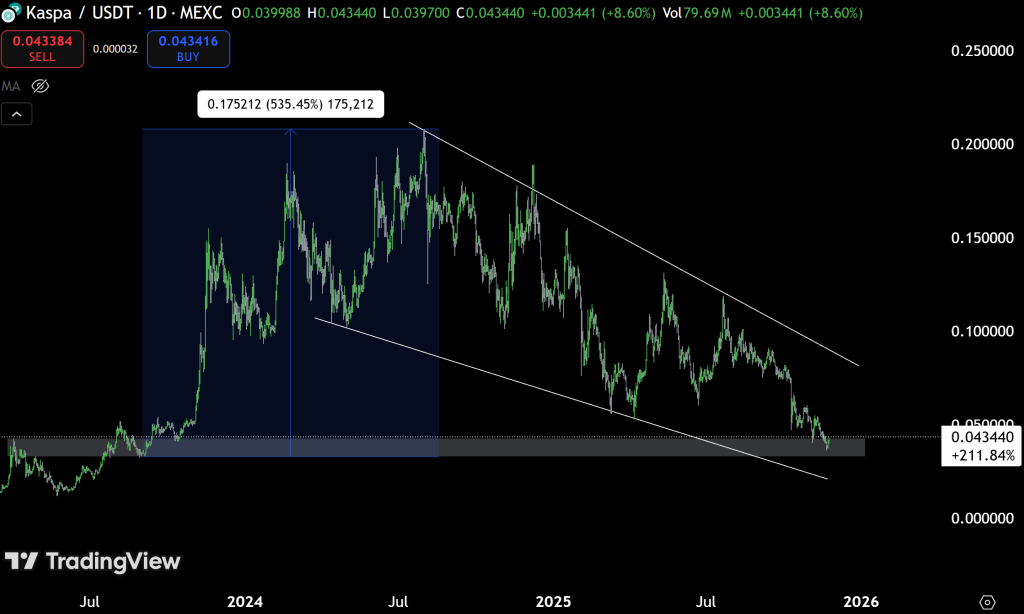
The falling wedge pattern is becoming increasingly compressed, with the price actively testing its upper trendline. The recent reaction from the support level suggests a market effort to defend this region, potentially signaling a trend reversal.
A key question remains whether this upward movement signifies the start of a structural recovery or merely a temporary bounce before further selling pressure emerges. This is where a deeper dive into technical indicators becomes crucial.
Kaspa Chart Analysis: Technical Momentum Turns Up
The indicators in the lower panel of the chart provide evidence of a shift in underlying market dynamics.
The Relative Strength Index (RSI) has shown a sharp upward trajectory, regaining momentum after several weeks of divergence. Historically, periods where the RSI printed lower lows while price held higher levels have been indicative of diminishing seller power. Today's price surge has pushed the RSI well above the midline, breaking its recent downtrend for the first time in weeks.
The Moving Average Convergence Divergence (MACD) indicator also displays a clear bullish crossover. The MACD histogram has turned green, and the moving averages are beginning to curve upward, a pattern that often precedes sustained upward price movements over multiple days. The technical momentum has not appeared this constructive since early October.
Perhaps one of the most compelling observations comes from the analysis of open interest data.
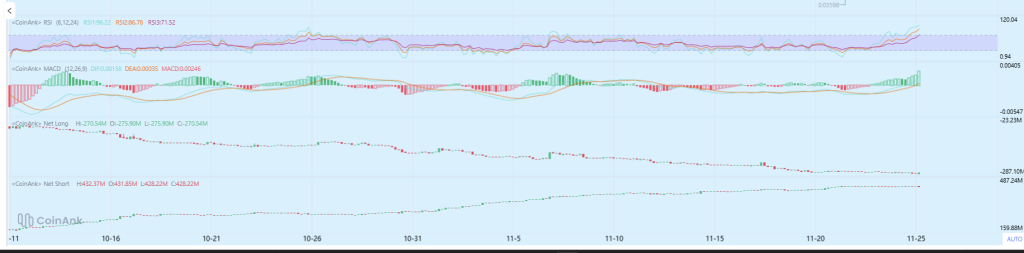
Net short interest has been on a steady ascent for several weeks, while net long positions have been significantly reduced during the price decline. This imbalance creates a fertile ground for explosive upward price movements. When the price eventually turns upward, short sellers are compelled to cover their positions, often leading to rapid price appreciation.
When this data is considered in conjunction with the retest of a major long-term support level, the technical setup becomes statistically favorable for at least a mid-term price bounce.
Short-Term Kaspa Price Outlook
If the current upward momentum continues, the immediate price target is projected to be between $0.058 and $0.060, which represents the upper boundary of the falling wedge and the initial significant resistance level. A decisive breakout above this wedge pattern could then expose the $0.07 level, a price point that traders abandoned during the liquidation cascade in November.
Conversely, if Kaspa fails to maintain its position above the $0.045-$0.046 support range, the falling wedge pattern could potentially drive the price back down into the lower support band, estimated to be between $0.037 and $0.039.
For the present moment, the chart indicators lean towards a bullish outlook. Momentum is shifting positively, short positions are heavily accumulated, and Kaspa's reaction at its current support level aligns with expectations for a potential bottom formation.
Whether this current move will replicate the previous 535% rally remains to be seen, but today's price action has provided the bulls with a significant and tangible basis for optimism.