

Key Technical Signals and Market Action
Chainlink faces a sharp downward move as trading activity rises across the session, while early technical signals begin forming near a key support region during a period of increased market pressure.
Chainlink received attention after analyst Ali shared a chart on social media stating that “Chainlink $LINK ready to rebound as the TD Sequential prints multiple buy signals.” His post shows a cluster of TD signals forming on the daily chart.
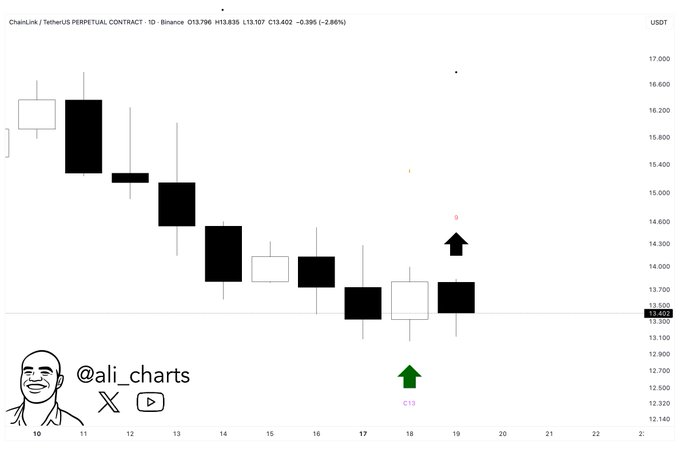
This formation follows a steady corrective phase marked by lower highs and lower lows. The pattern appears as the market records smaller candle bodies and reduced selling progress, showing early signs of slowing momentum near the current range.
Long lower wicks appear across recent sessions as demand forms at intraday lows. The TD Sequential “9” count sits above this zone, which often marks areas where trend fatigue emerges. Ali’s chart shows several signals aligning at the same level, drawing interest from market participants.
Sharp Decline With Rising Trading Activity
Chainlink as of writing, trades at $12.76 after falling 7.02% in the past day. The intraday chart shows a drop from the $13.77 region before sellers accelerate pressure, driving LINK through multiple support layers during the session.
Trading volume increases 34.86% to $1.07B as the decline unfolds. High activity during a sharp move often suggests broad participation from sellers or short-term exits. The volume-to-market-cap ratio at 12.07% confirms that liquidity remained active throughout the session.
Attempted recoveries form lower highs across the chart, showing that buyers could not regain control. Chainlink maintains a stable token structure with 696.84M in circulation and a 1B max supply, meaning supply conditions remain unchanged during the downturn.
Support Range Holds as Broader Access Expands
Chainlink continues to defend the $13.30–$13.50 region, which aligns with a prior area of demand. The TD signals shared in Ali’s chart appear directly above this range, making it a focal point for traders monitoring stabilization attempts.
Market behavior near the zone shows a shift from heavy selling to early consolidation. The slower pace of decline suggests that the market is testing the current level after a rapid downward move. This aligns with the structure visible in the shared chart.
Institutional visibility continues to grow as new ETP listings on Nasdaq Stockholm include Chainlink. These products expand access for regulated investors and offer steady market exposure during periods of volatility, even as short-term pressure persists.