

Key Insights
- •Litecoin is currently trading within the $80–$83 range, testing a significant trendline and a demand zone established in mid-2023.
- •A daily close below $80 could lead to a decline towards $75, with $70 identified as the subsequent support level.
- •A Wyckoff pattern suggests a potential for a more substantial drop to $45 or $25 if the current markdown phase persists.
Current Market Position and Short-Term Outlook
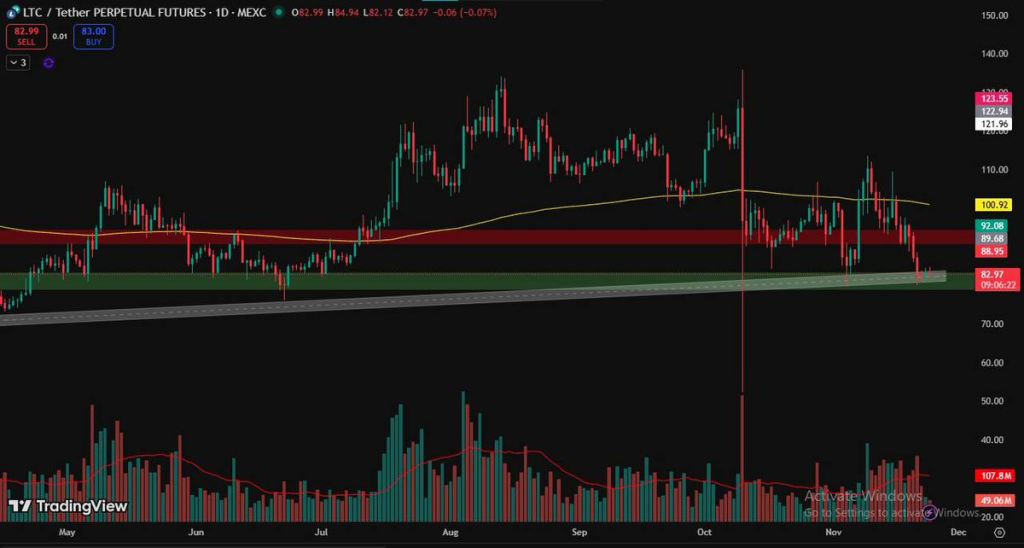
Litecoin (LTC) is trading around $83.92, positioning it directly within the $80–$83 demand zone. This area has historically provided strong support for the cryptocurrency. Furthermore, this price range aligns with a rising trendline observed on the daily chart since the middle of 2023. Market participants are closely monitoring price action at this critical level, as it is expected to influence the short-term trajectory of LTC.
Analyst Mayank Dudeja has indicated that a sustained price above the $80–$83 zone would maintain a bullish market structure, with potential targets at $89–$92, and subsequently reaching $100. A rebound from the current support level could indeed bring these higher price points into consideration, with the 200-day moving average near $100 often serving as a significant resistance level during recovery periods.
Potential Breakdown Below $80
A daily close below the $80 mark would signify a definitive break of the current rising trend structure for Litecoin. Should this occur, the price could face downward pressure, with immediate lower support levels anticipated around $75. If this level fails to hold, the next significant support zone is expected to be near $70. The recent increase in red volume bars on trading charts suggests growing selling pressure, which heightens the possibility of a breakdown from the current support area.
Dudeja further elaborated on the bearish scenario, stating that a close below the trendline would indicate a bearish shift in the market, directing prices towards $75 and then $70. This highlights the critical nature of the current price level as a potential turning point for Litecoin's market direction. While the demand zone is currently holding, the price action in the upcoming days will be crucial in confirming the next market movement.
Broader Risk Scenario with Wyckoff Distribution Model
In a broader analysis, Crypto Lama has presented a view of Litecoin mapped against a Wyckoff distribution model on the weekly chart. This model suggests a long-term distribution phase that appears to be transitioning into its markdown phase. Litecoin has already experienced a breakdown below a wedge pattern that had previously supported its price since 2020.
This particular scenario outlines a potential path where Litecoin could decline towards $45, then to $25, and possibly even as low as $10, before initiating a prolonged recovery. Lama commented on the unusual aspect of this scenario, not just the potential return to the $10–$50 range, but the subsequent projection of Litecoin reaching $2,000 after completing the identified flat pattern. The emphasis in this analysis is on preparing for potential risks rather than making definitive predictions.
Concluding Price Action Analysis
In the last 24 hours, Litecoin has seen a modest gain of 0.6%, although it remains down by 11.1% over the past week. The current price is situated at a critical decision zone, attracting the attention of both short-term traders and long-term investors. The subsequent trend for Litecoin in the coming weeks will likely be determined by whether the $80 support level holds or experiences a breakdown.