

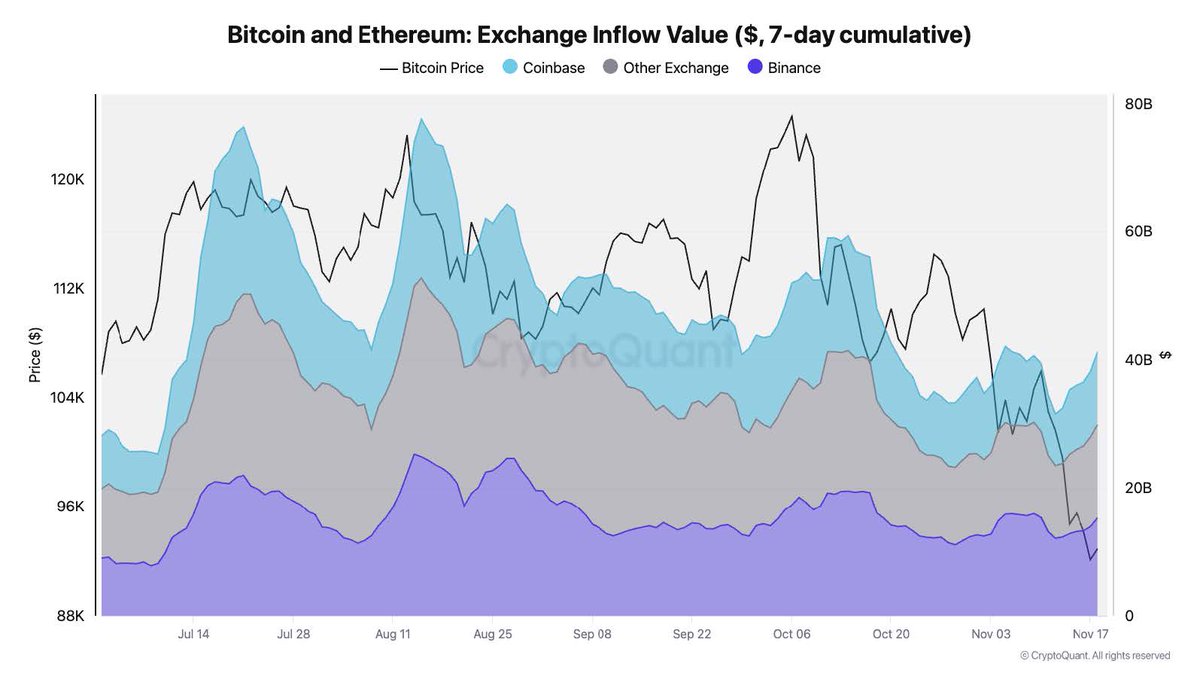
Fresh data shows that, despite the recent price weakness in Bitcoin and Ethereum, large amounts of capital are still pouring into centralized exchanges. The chart highlights that daily inflows across all platforms have climbed to roughly $40 billion, underscoring that traders continue repositioning aggressively during this phase of volatility.
Binance Remains the Dominant Liquidity Hub
Binance stands out as the strongest inflow destination. The exchange captures around $15 billion per day, representing more than one-third of total BTC/ETH inflows across the ecosystem. That puts it comfortably ahead of Coinbase, which sits at around $11 billion over the same period.
The inflow distribution illustrates that both institutional players and high-volume retail traders still rely heavily on Binance for large, liquid moves in the top two crypto assets.
What the Chart Shows
The visual plots Bitcoin’s price alongside a 7-day cumulative inflow breakdown for Binance, Coinbase, and other exchanges. Binance’s inflow layer consistently appears as the most dominant segment, even during periods of sharp price retracement. The pattern suggests that capital rotation is ongoing rather than drying up, an important distinction during market pullbacks.
As Bitcoin fluctuates between $88K and $120K across the timeframe in the chart, inflow spikes align closely with volatility surges, reinforcing the idea that traders continue using Binance as a primary venue for repositioning during stress.
Why These Flows Matter
Sustained inflows at this scale typically indicate that liquidity remains active, not sidelined. When capital continues moving into exchanges, especially into the largest venue, it often reflects upcoming recalibration rather than exhaustion. Whether this flow leads to stronger accumulation or a continuation of short-term volatility will depend on how price reacts during the next liquidity wave.