

MYX Finance (MYX) has taken a dive in the last 24 hours, losing 35% as the token slipped from repeated resistance tests at $17.06 down below a support range between $9.4 and $8.83, according to TradingView.
The move came after several failed attempts to reclaim higher ground, which raised the questions about what could come next, and why momentum shifted so quickly in October despite over cryptocurrency being favoured by the bullish month.
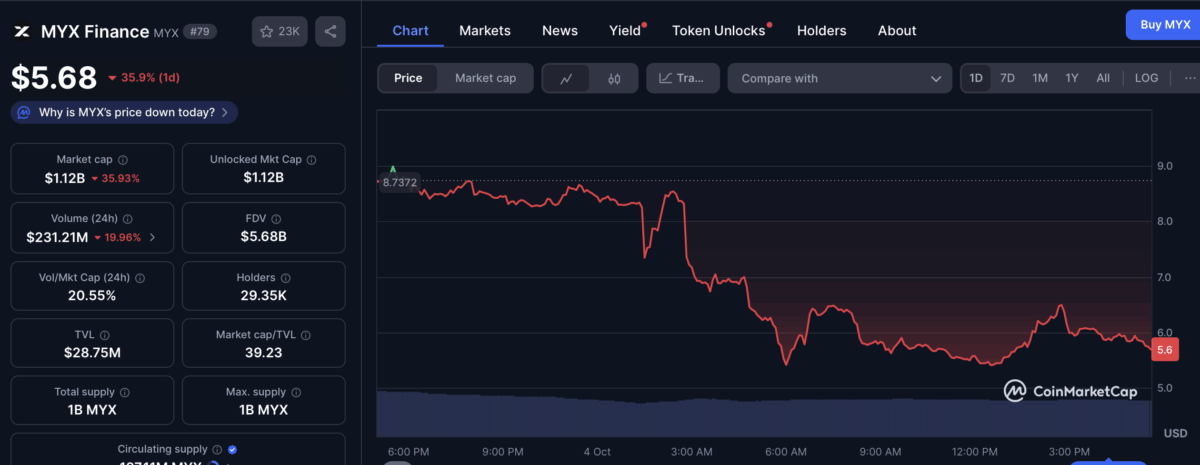
The token is currently trading for 5.68% as of the time of writing, with market cap down by 35.93% to $1.12 billion. This is after a 7‑day losing streak of about 60%. Meanwhile, this same token experienced a massive 402.84% surge over the last month, according to CoinMarketCap. So what changed?
On the daily chart via TradingView, it looks like there’s a struggle between buyers and sellers but the sellers are currently dominating.
The Moving Average Convergence Divergence (MACD) histogram remained in red territory, showing bearish conditions, though the narrowing bars suggested that selling momentum was weakening and might pave the way for a recovery attempt soon.

But despite this, caution continued as the Exponential Moving Average (EMA) pointed to a bearish crossover. In addition, the 12 EMA line slipping below the 26 EMA made it difficult for MYX to break through resistance levels without stronger buyer participation.
However, the token still has a chance to recover only if it retest the 8.29 support turned resistance zone and gather enough momentum to break over it. But, if that doesn’t happen, MYX has a possibility of dropping deeper and extending the period of bearish pressure in the market.