

NEAR Protocol is approaching a technically significant moment after spending several years compressing inside a descending wedge structure.
According to analysis shared by Crypto Patel, the pattern has been forming since NEAR’s 2021 all-time high and is now reaching its decisive phase.
Multi-Year Structure Reaches Critical Support
Crypto Patel’s chart highlights a long-term descending wedge, with price currently trading around $1.78. This level aligns with two key technical supports visible on the chart: the 0.786 Fibonacci retracement and a rising bullish trendline. The confluence suggests that selling pressure has been gradually absorbed while price volatility continues to compress.
$NEAR Protocol: The 3,000% Setup Nobody Is Talking About
Multi-year descending Wedge Forming Since 2021 ATH. Currently at $1.78, sitting on 0.786 Fib + Bullish Trendline Support.
➡ Breakout > $5
➡ Targets: $21 (ATH) → $48+ (Full Extension)
❌ Invalidation: Weekly Close <… pic.twitter.com/DD3brpKGOk— Crypto Patel (@CryptoPatel) January 17, 2026
The structure implies a classic accumulation phase transitioning toward potential expansion, provided price breaks convincingly above wedge resistance.
Breakout Level and Upside Scenarios
The analysis identifies $5 as the key breakout threshold. A confirmed move above this level would signal a structural shift out of the multi-year downtrend. In that scenario, projected upside targets shown on the chart extend first toward the prior all-time high near $21, with a full extension scenario reaching $48+ if momentum accelerates.
These targets are derived directly from the wedge expansion and Fibonacci projections displayed in the visual analysis.
Invalidation and Risk Framework
The setup includes a clearly defined risk level. A weekly close below $1.40 would invalidate the bullish thesis, breaking the underlying trendline support and negating the wedge structure. Until that level is lost, the broader bias remains constructive, with Crypto Patel describing the setup as “bullish on breakout.”
Short-Term Price Context
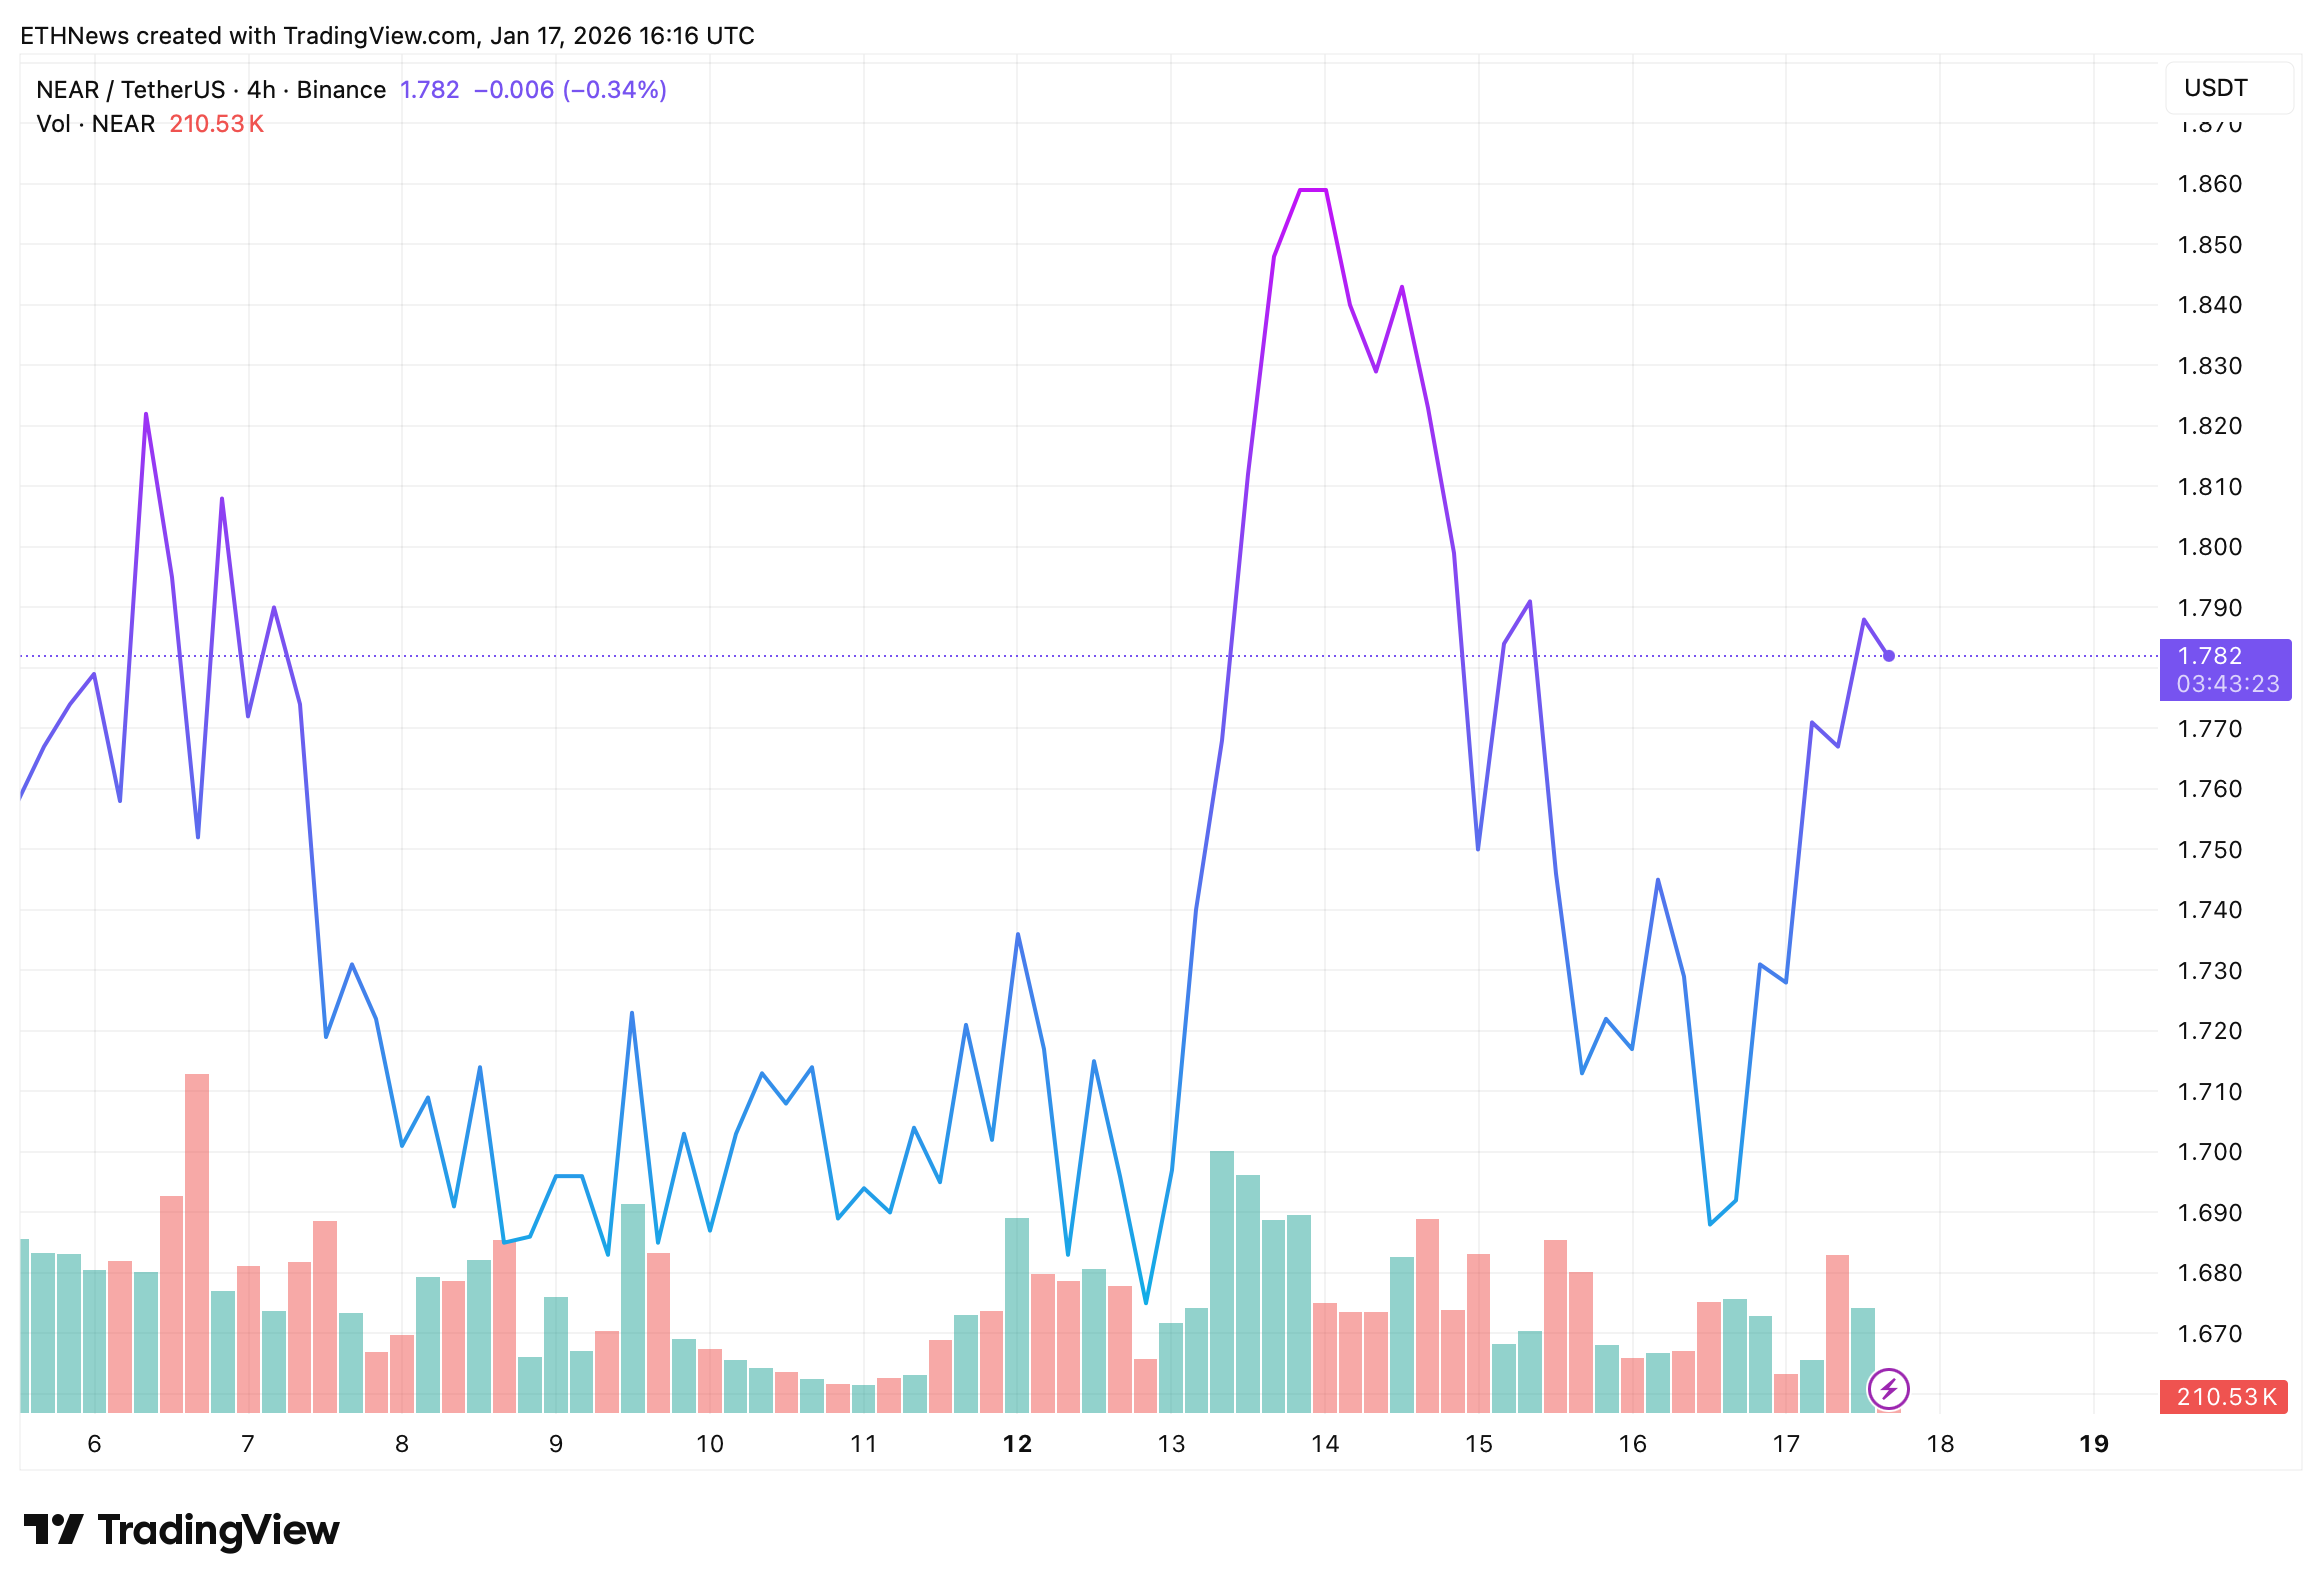
NEAR/USDT chart shows price stabilizing near $1.78, with recent volatility spikes followed by sharp pullbacks and rebounds. Trading volume remains active around this range, reinforcing its importance as a near-term equilibrium zone while the larger pattern continues to tighten.
Market Phase: Accumulation to Expansion
Based solely on the uploaded charts and commentary, NEAR appears to be in the late stages of accumulation. The narrowing price range, long-term support alignment, and defined breakout structure suggest the market is waiting for confirmation before committing to directional expansion.
As emphasized in Crypto Patel’s analysis, confirmation remains key, with risk management centered around the $1.40 weekly level and upside dependent on a clean break above $5.