

Pi Network price has remained horizontal over the past four weeks, characterized by weak demand and a continuous rise in supply.
Market Overview
Pi Coin (PI) value has been trading around the $0.2050 level, which corresponds to its lowest point in November. This represents a significant drop of over 90% from its peak price recorded in 2025.
The persistent weakness in price has been accompanied by low trading volume. The 24-hour trading volume has fallen to $7 million. This figure is notably low when considering the overall crypto market's 24-hour volume, which stood at $60 billion during the same period. For a cryptocurrency with a market capitalization exceeding $1.7 billion, this volume is considered minimal.
Concurrently, the supply of Pi Coin has been increasing due to daily token unlocks. The network is unlocking over 100 million tokens this month, with projections indicating 1.2 billion tokens will be unlocked over the next 12 months.
Further analysis of network activity reveals a decrease in the number of large holders, often referred to as whales. The number of Pi Network whales, defined as users holding tokens valued over $10 million, has dropped from 23 to 20 earlier this year. However, the largest whale continues to accumulate Pi Coin, now holding over 393 million tokens, valued at more than $80 million.
The Pi Network price has also experienced fluctuations due to a lack of significant market-moving news from the development team. The most recent notable announcement occurred on January 10, with the launch of a new developer library designed to simplify the integration of Pi payments into Pi applications.
Pi Network Price Technical Analysis
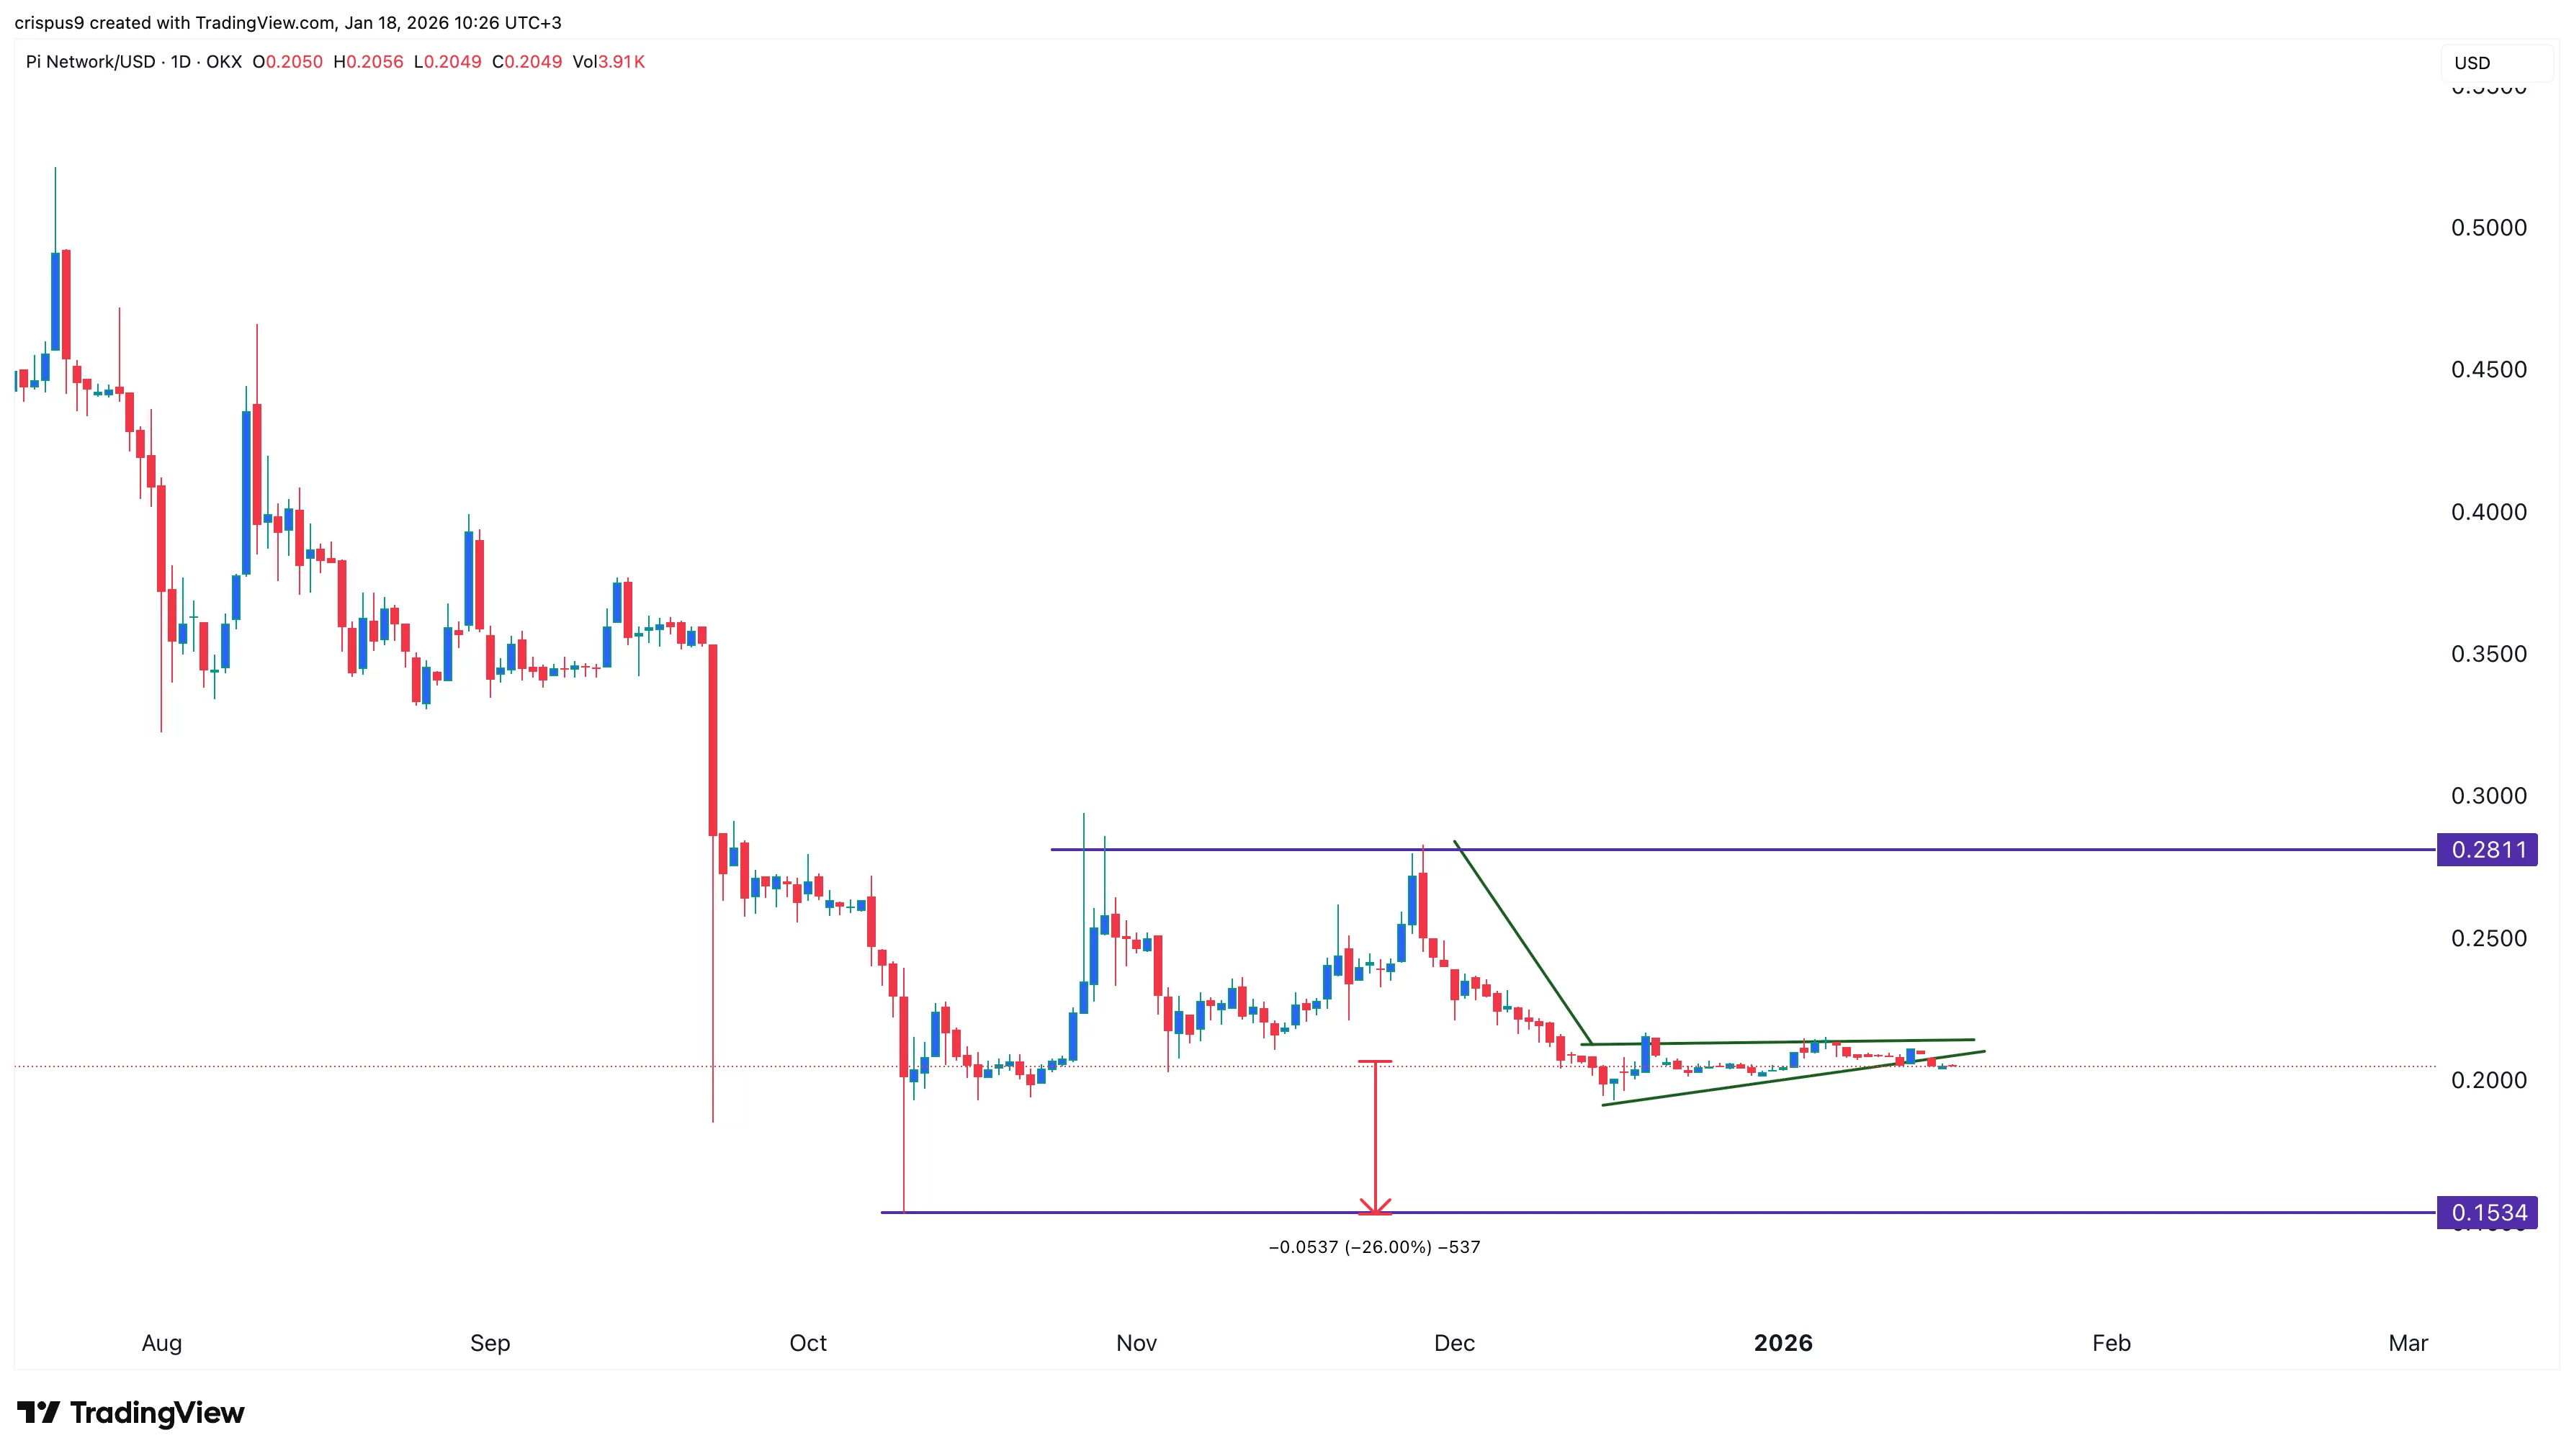
On the daily timeframe chart, the Pi Coin price has exhibited a sideways trend in recent weeks. This period of consolidation has led to a decrease in the Average True Range (ATR) indicator, signaling low volatility.
The token has consistently traded below the 50-day Exponential Moving Average (EMA) and the Supertrend indicator. A significant observation is the formation of a rising wedge pattern, characterized by two ascending and converging trendlines. Additionally, a bearish pennant pattern has also formed.
Based on these technical indicators, the most probable scenario suggests a substantial bearish breakdown in the coming days. Sellers are likely to target the all-time low of $0.1534, which was recorded in October of last year.
Conversely, a price movement above the resistance level at $0.2250 would invalidate this bearish outlook.