

Polkadot is trading firmly higher on Wednesday, with price consolidating near recent highs after a sharp upside move.
On Binance, DOT/USDT was last seen at $2.259, up 3.2% on the 24 hour chart, as trading volume expanded to 668.96K during the latest advance. The move marks a clear shift from the choppy downside action that dominated earlier sessions.
Price surged from the $2.06 area, where DOT spent several days oscillating in a narrow range. That base gave way to a rapid push above $2.24, carrying price briefly toward the $2.28 region before momentum cooled. Rather than reversing, DOT has settled into a tight consolidation, holding above the level it previously struggled to clear.
Current Price Action Shows Stabilization Above Former Resistance
The latest four-hour chart reflects a decisive change in short-term behavior. Earlier price action was defined by uneven rebounds and lower highs, but the most recent sequence shows a near-vertical expansion followed by controlled sideways movement. This type of pause keeps price elevated instead of pulling it back into the prior range.
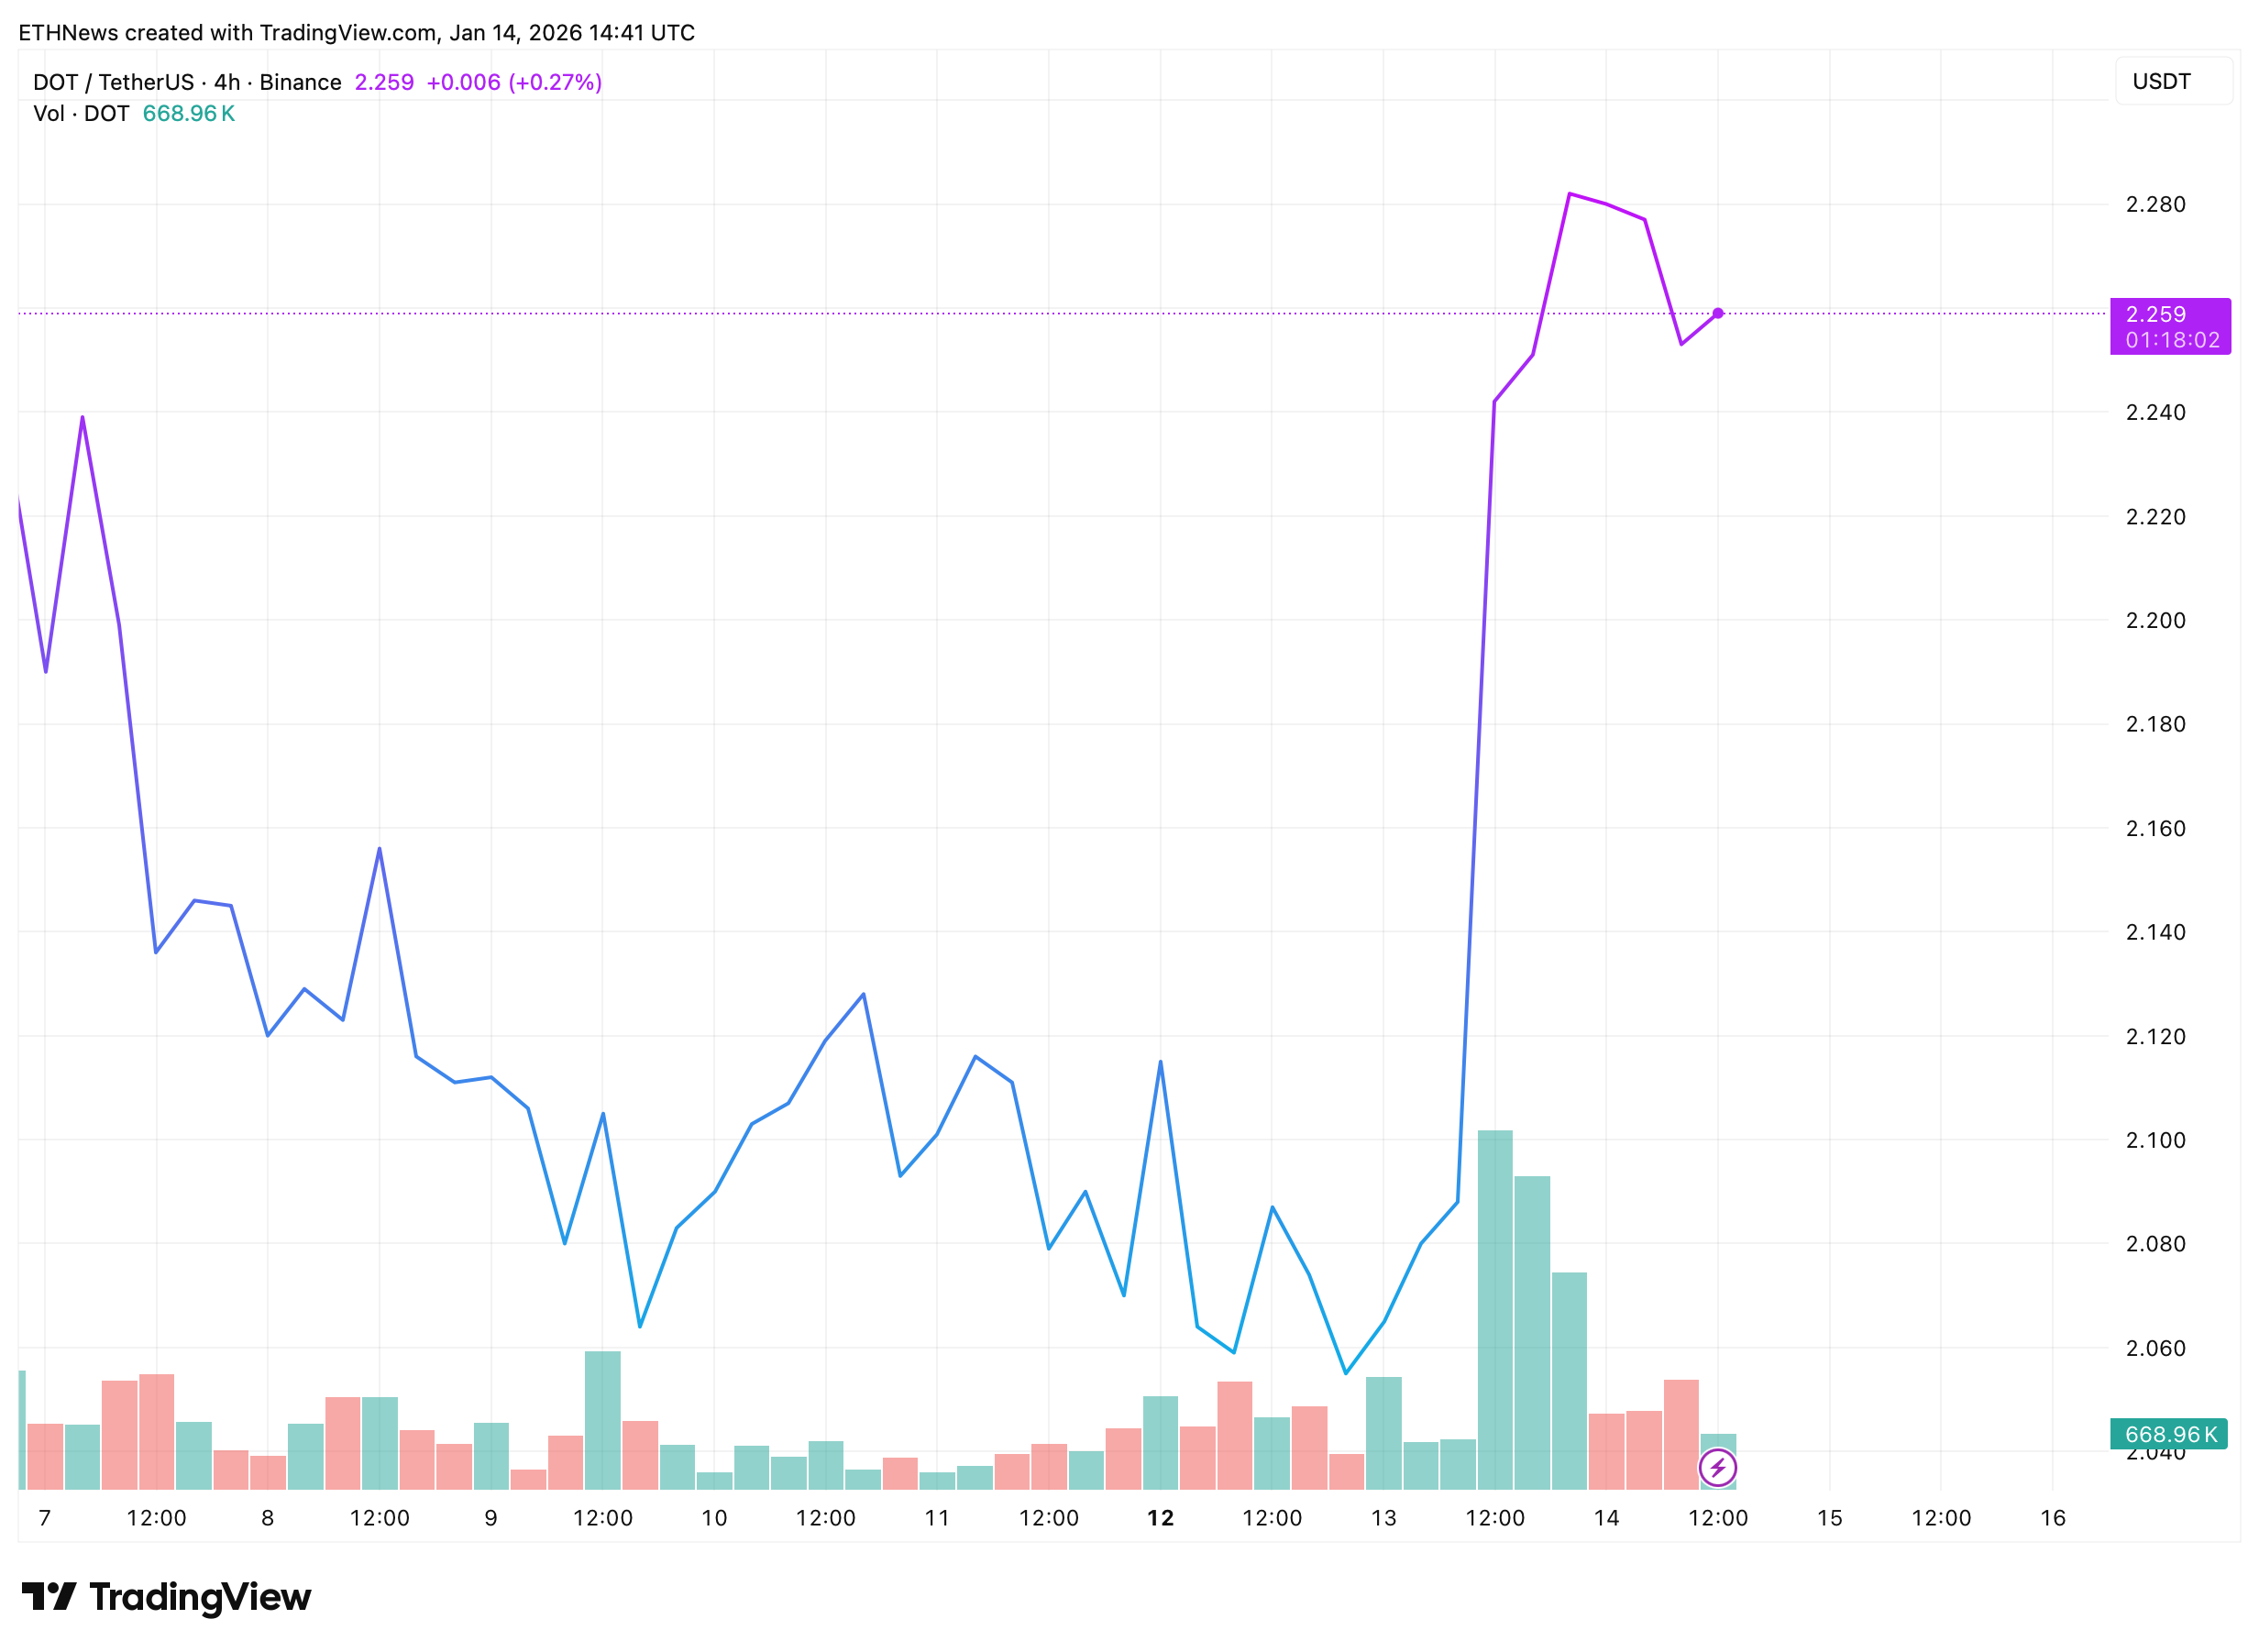
DOT is currently hovering just below its recent intraday peak, with $2.24–$2.25 standing out as the key area holding the structure together. The lack of a deep retracement back toward $2.10 suggests the market is digesting gains rather than unwinding them. Volume picked up noticeably during the breakout leg and remains visible during consolidation, reinforcing the idea that the move has not fully lost participation.
Structural Flip After Prolonged Basing Phase
A separate technical view shared by crypto trader GainMuse focuses on a wider breakout framework developing on the DOT/USDT chart. The analysis highlights an extended basing period followed by a clean exit from consolidation. In that structure, price breaks out of a triangle pattern and reclaims an ascending support line, shifting the short-term alignment upward.
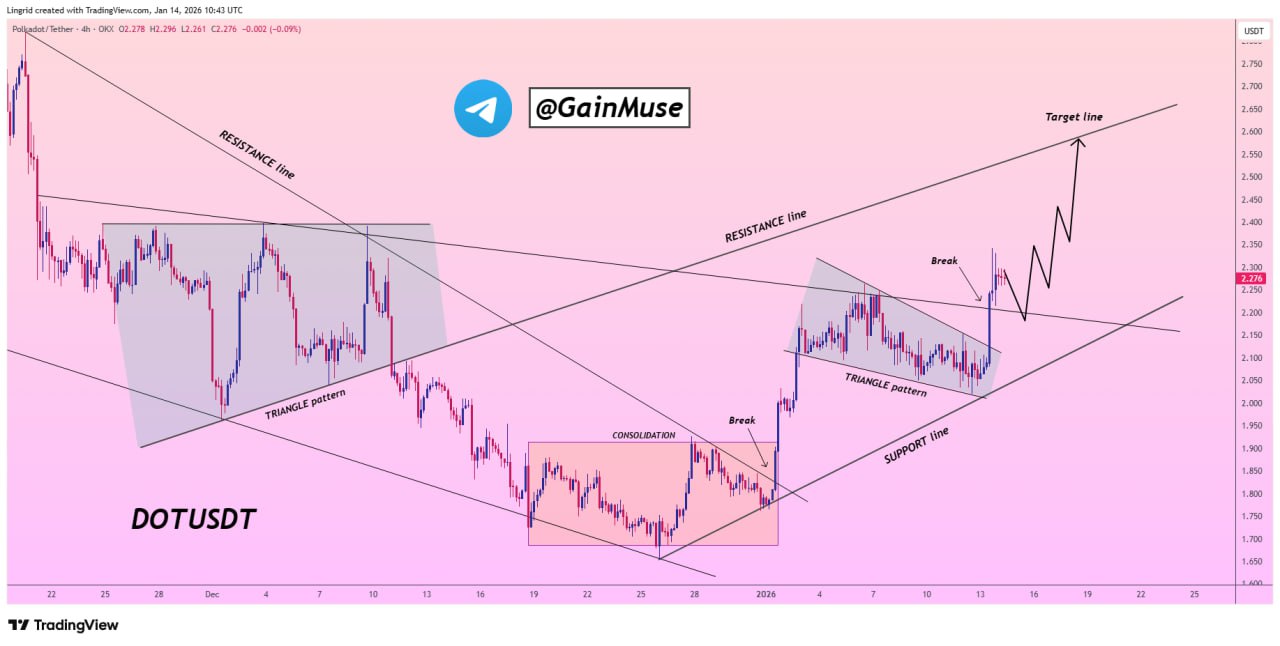
The chart marks former resistance turning into support, with DOT compressing beneath an upward-sloping resistance line after the breakout. The projected path shown favors continuation through a sequence of higher swings rather than a straight-line move. According to the analysis, this structural flip reflects bulls regaining control as the market transitions out of consolidation and into an advancing phase.
Together, the current price chart and the GainMuse framework point to the same key test: whether DOT can continue holding above reclaimed support while absorbing recent gains. For now, price remains anchored above earlier resistance, keeping the breakout attempt active rather than invalidated.