

Key Insights
- •Polkadot price surged 10% after its listing on Robinhood, exposing it to a wider retail trading audience.
- •A breakout from a multi-month falling wedge pattern suggests a potential rally toward the $4 level.
- •Whale accumulation and increased leverage in futures markets reflect growing optimism in DOT's short-term performance.
Polkadot price climbed 10% on January 14, following increased market exposure due to its listing on the Robinhood trading platform. The price moved to an intraday high of $2.32 before stabilizing at $2.29. This placed the altcoin 38% above its December low, reflecting renewed bullish sentiment.
Robinhood's spotlight on Polkadot has opened the token to millions of retail investors in the U.S. This visibility is expected to draw new liquidity and trading volume. The announcement was a key driver in Wednesday's rally, as market participants responded positively to the listing.
Whale Accumulation Strengthens Market Confidence
According to blockchain analytics from Nansen, large wallet addresses have resumed accumulation of DOT. Whale entries typically signal institutional or high-confidence investor activity, often followed by increased retail buying. This accumulation trend aligns with the recent surge in price and volume.
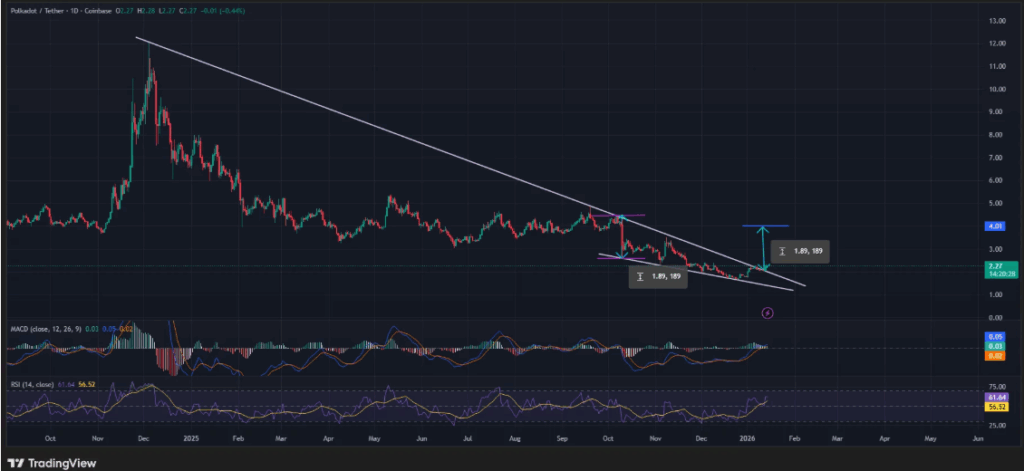
Polkadot broke out of a falling wedge pattern that had been developing since October. The breakout is seen as a bullish reversal signal, with price action now moving above a multi-year descending trendline that previously acted as strong resistance. The pattern indicates a potential move toward $4, which would represent a 74% increase from current levels.
Derivatives Market Supports Uptrend Outlook
Data from CoinGlass shows a 15% increase in Polkadot futures open interest within 24 hours, now totaling $231 million. Additionally, the weighted funding rate turned positive, showing that more traders are betting on rising prices. This signals increasing optimism across the derivatives market.
On the technical side, the MACD has crossed above the zero line, with the histogram expanding, indicating growing bullish momentum. Meanwhile, the RSI shows a bullish divergence, a common precursor to a sustained recovery in price. Both indicators support the ongoing uptrend in the near term.