

After a prolonged period of weakness, Polkadot (DOT) is showing signs of a powerful turnaround. Recently discussed by experts, the asset may have entered the “Spring” phase of the Wyckoff methodology, which is often viewed as an indicator of a major trend reversal, suggesting that the market is preparing to recover from the bottom.
The Market Seeks Balance Through Support Testing and Quick Reaction
Following a sharp decline at the beginning of December, DOT’s price chart revealed strong buyer reaction around the $2 level. The presence of a long lower wick in the chart signifies the breaking of selling pressure and the onset of aggressive buying. This formation is a classic feature of Wyckoff’s Spring model: a brief, sharp dip below the support level, elimination of weak investors, followed by a rapid recovery.
After this recovery, DOT rose to the $2.30 level but was met with resistance, pushing it back to the $2.12 region. The price action reflects a structure where the market is trying to find balance following a prolonged downtrend.
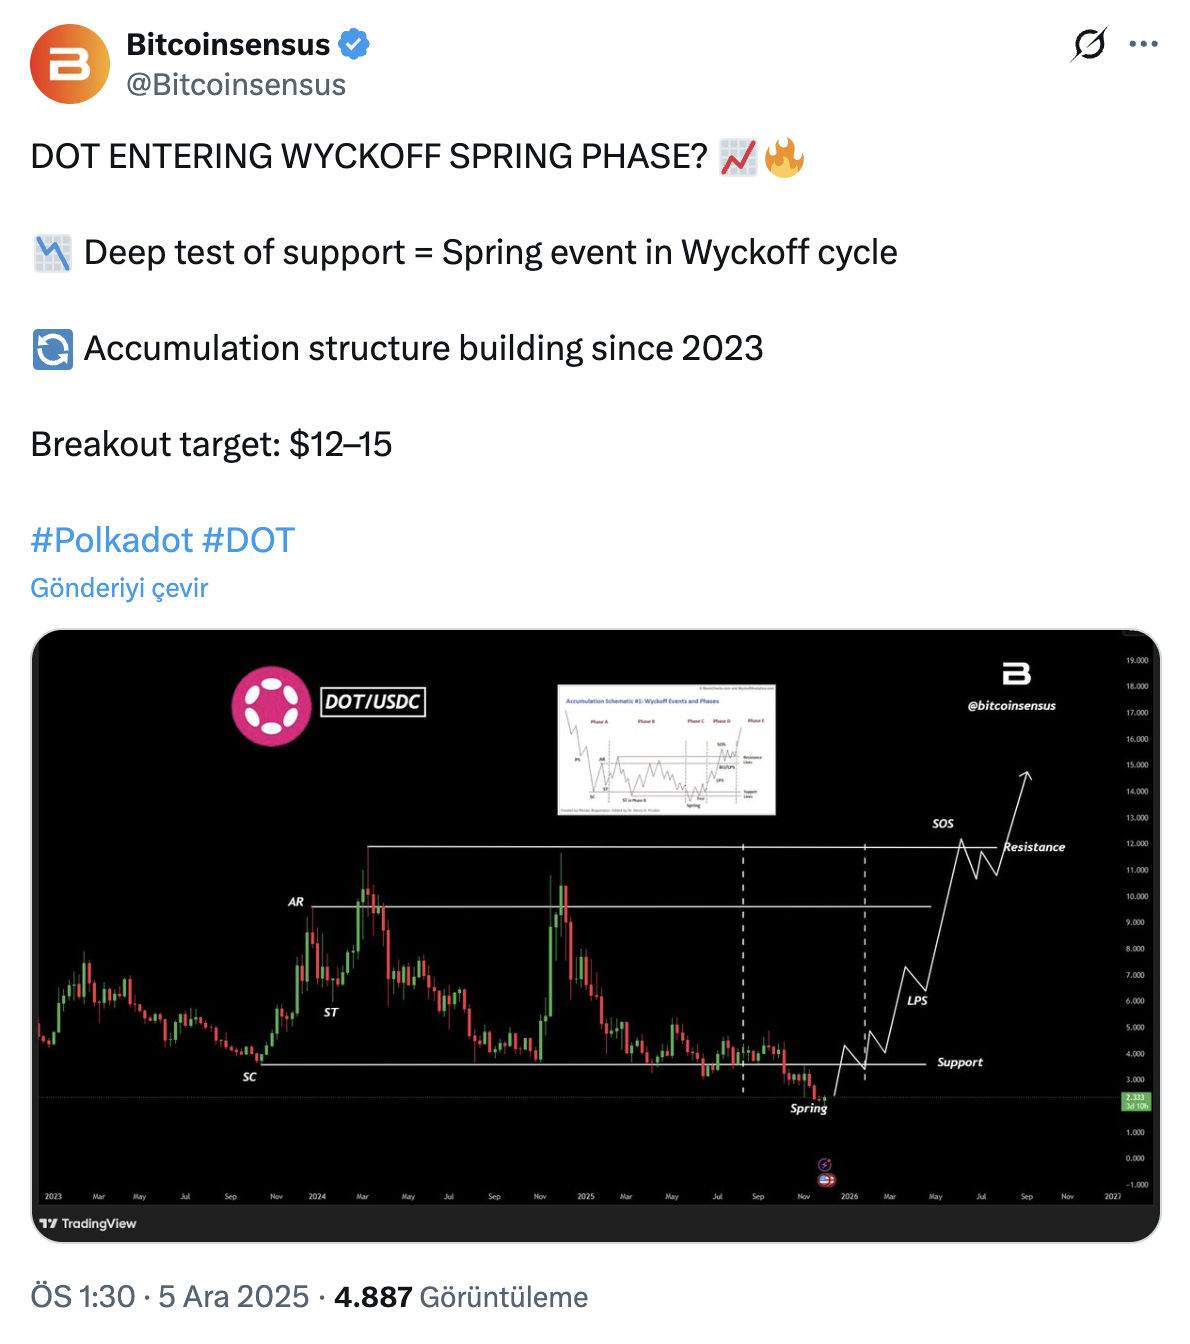
Experts suggest that DOT has been forming an accumulation structure since 2023, and the current deep support testing aligns with the Spring criteria. According to Wyckoff’s theory, the Spring phase is the last shakeout before a major rally begins. Analysts also indicate that breaking above the $2.30 – $2.50 range could signal a strong “Sign of Strength” (SOS), with potential targets between $12–15.
Wyckoff Roadmap and DOT’s Position
The application of Wyckoff’s methodology on DOT highlights the following stages in the charts:
- •SC (Selling Climax): The initial large-volume sell-off
- •ST (Secondary Test): Retesting the support region
- •AR (Automatic Rally): The first strong rebound
- •Spring: The final dip below support (DOT is currently thought to be in this stage)
- •LPS (Last Point of Support): Formation of higher lows
- •SOS (Sign of Strength): Initiation of upward momentum with the break of resistance
Should Polkadot adhere to this structure, the next step would be sustained closures above mid-range resistance. If this occurs, the price is expected to gain momentum towards higher levels.
Parallel to these technical developments, a significant highlight within the Polkadot ecosystem is the recent activity in the developer sphere. Blockchain analysis platforms reemphasize that Polkadot remains one of the most active projects in the Web3 development space. This suggests a strong growth momentum at the ecosystem’s core despite price pressures, supporting a positive long-term outlook.
In conclusion, Polkadot’s current price structure may indicate the latter stages of an accumulation phase following a long downtrend. The potential for a Wyckoff Spring offers a technically optimistic scenario; however, the confirmation of this pattern requires the price to rise above resistance levels, a fact investors should keep in mind.