

Polkadot is flashing early signs of a potential market reversal after a deep retest of support, with analysts now examining whether the asset has entered the Wyckoff “Spring” phase, one of the strongest bullish signals in accumulation cycles.
The technical setup, highlighted by Bitcoinsensus, comes at a time when DOT has shown renewed intraday volatility and a sharp rebound from its recent lows.
Chart Shows Sharp Dip Followed by Quick Recovery
The price chart reveals a decisive breakdown near the start of December, where DOT dropped aggressively before buyers stepped in around the $2.00 zone. The sharp wick recovery, seen on the TradingView chart, is characteristic of the Wyckoff Spring pattern, an event where price dips below support to trigger stop-losses and shake out weak holders.
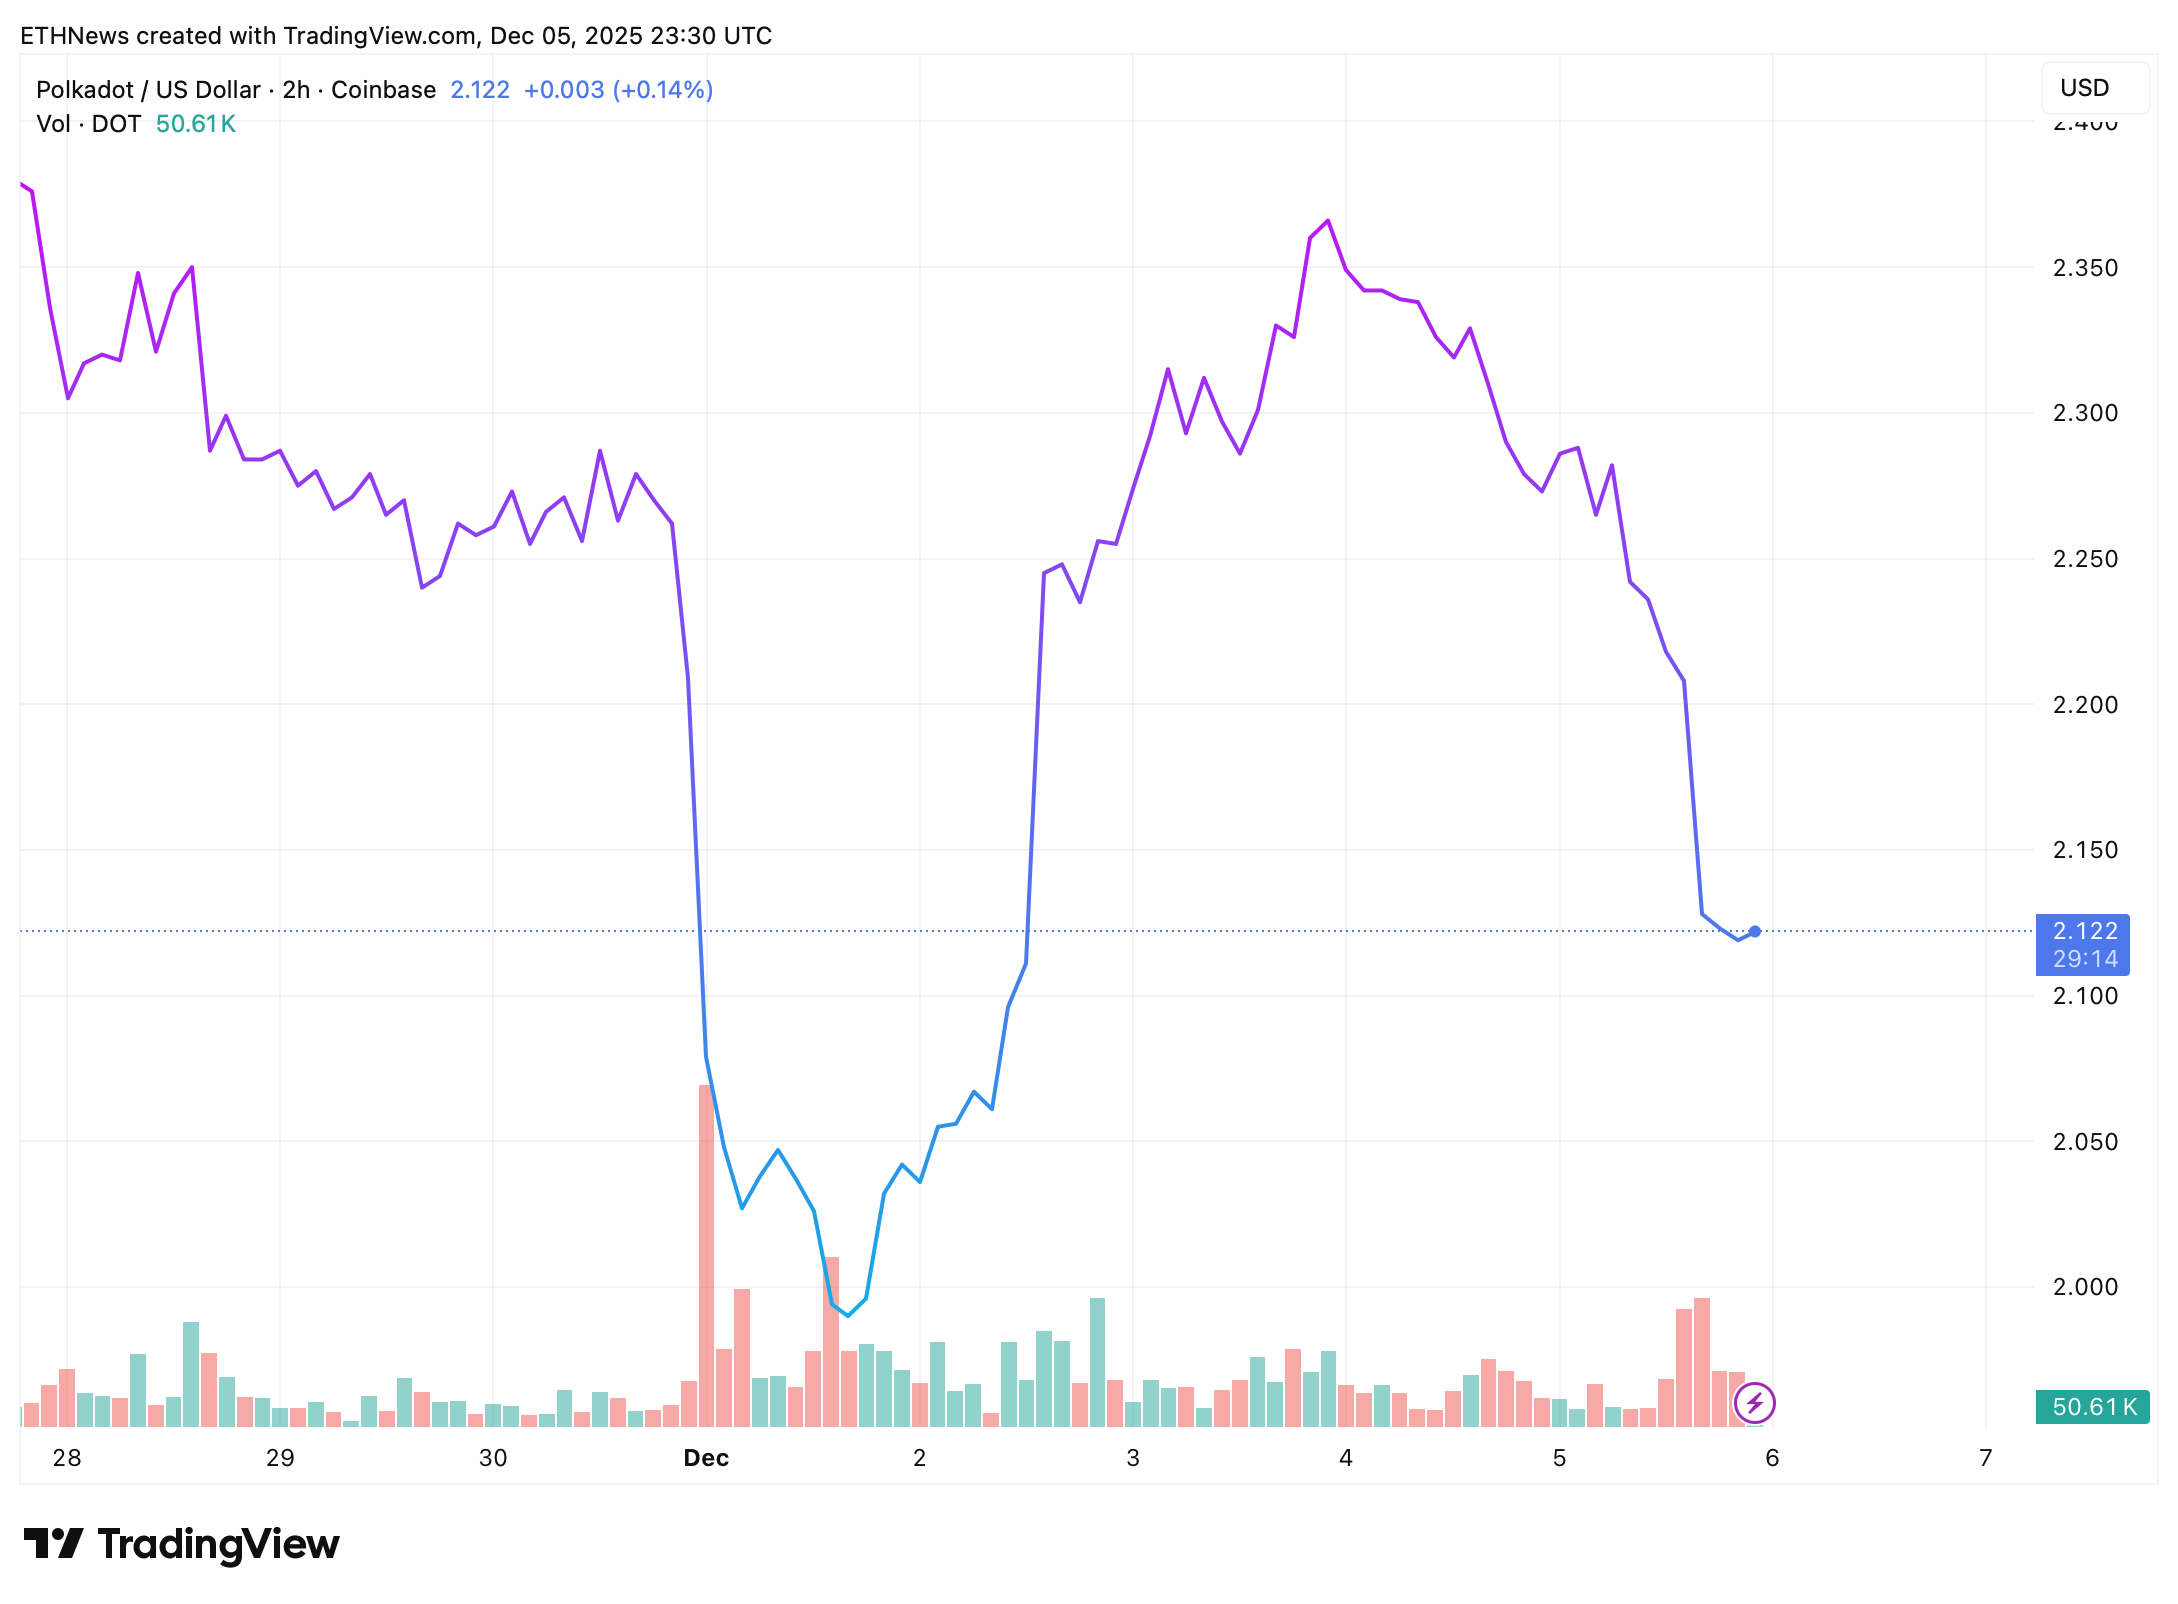
After the bounce, DOT climbed back toward the $2.30 region before encountering rejection, retracing again toward the $2.12 zone at the time of chart capture. The pattern reflects a market trying to stabilize after a multi-month downtrend.
Analysts Suggest DOT May Be Completing Multi-Year Accumulation
Bitcoinsensus notes that DOT’s accumulation structure has been forming since 2023, with the current deep support test fitting the criteria for a Wyckoff Spring. In classical Wyckoff theory, the Spring is the final shakeout before a major trend reversal. The analyst highlights:
- •A deep test of support, consistent with Spring behavior
- •A multi-year accumulation range
- •A potential upcoming Sign of Strength (SOS) if price breaks above resistance
The breakout target shared: $12–$15, representing a substantial upside from current levels.
DOT ENTERING WYCKOFF SPRING PHASE? 📈🔥
📉 Deep test of support = Spring event in Wyckoff cycle
🔄 Accumulation structure building since 2023
Breakout target: $12–15 #Polkadot #DOT pic.twitter.com/Z8QK6CRbCT
— Bitcoinsensus (@Bitcoinsensus) December 5, 2025
How the Wyckoff Roadmap Applies to DOT
The chart shared by Bitcoinsensus outlines the typical Wyckoff structure:
- •SC (Selling Climax): Initial large-volume breakdown
- •ST (Secondary Test): Retest confirming strong support
- •AR (Automatic Rally): First significant bounce
- •Spring: Final liquidating move, where DOT may be now
- •LPS (Last Point of Support): Higher lows confirming market demand
- •SOS (Sign of Strength): Breakout through resistance
If DOT follows this textbook structure, the next key development would be a sustained move above the mid-range resistance, opening the path toward higher levels.
Volatility Remains High as Market Waits for Confirmation
Despite the bullish setup, the current DOT/USDT chart shows choppy movement, sharp rises followed by equally rapid selloffs. Volume remains modest, suggesting that stronger conviction is still needed for a full trend reversal. DOT is hovering near $2.12, holding above its recent lows but not yet showing a clear breakout.
Until DOT can reclaim key resistance levels, the Wyckoff Spring remains only a possibility rather than a confirmed trend shift.