

XRP is currently forming a chart pattern that bears a striking resemblance to its behavior preceding the significant rally in 2017. Market observers are closely monitoring this development as the cryptocurrency tests key levels that were last seen during that major price surge.
The current price movements are occurring within a long-standing channel structure that has historically guided XRP’s price action for over a decade.
Price Moves Within Long-Term Channel
A monthly chart analysis shared by EtherNasyonaL illustrates that Ripple’s token is trading within an upward-sloping channel that dates back to 2014. This channel is defined by lower support levels, a central median band, and an upper boundary. Historically, XRP’s price movements have consistently reacted to these established levels.
During the fourth quarter of 2017, XRP experienced a notable breakout above the middle band of this channel. Following a brief period of sideways consolidation, the token embarked on a significant surge, eventually reaching a peak price near $3. A remarkably similar setup is currently forming in the fourth quarter of 2025. XRP recently touched the middle band of the channel, encountered rejection, and is now consolidating below this level. The analyst commented on this observation:
$XRP a different perspective. 🔃 Q4 2017 After breaking the middle band of the channel, XRP peaked in a parabolic rise within a few months. Q4 2025 In the same channel structure, the price again touched the middle band, was rejected, and then began to accumulate. The chart… pic.twitter.com/Zd0nezIpKL
— EᴛʜᴇʀNᴀꜱʏᴏɴᴀL 💹🧲 (@EtherNasyonaL) October 23, 2025
At the time of this report, XRP is trading at $2.44, with daily trading volume exceeding $3 billion, indicating robust market activity during this phase.
Chart Projects $9.90 Target
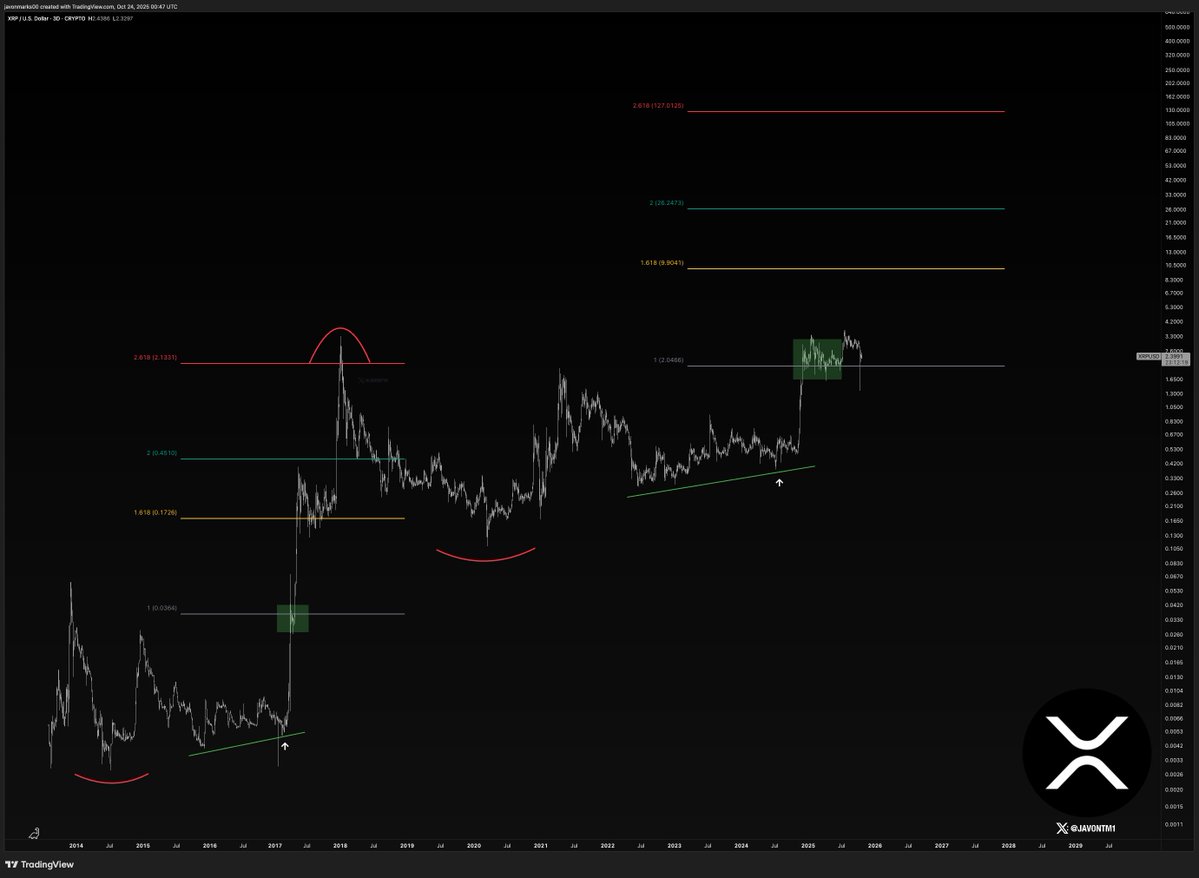
Another technical analysis, provided by Javon Marks, compares the current XRP setup with the historical breakout in 2017. This analysis utilizes historical price movements and Fibonacci extensions to forecast potential future price zones. The next significant target identified is $9.90, which would represent a substantial 310% increase from current price levels.
“Due to the extreme similarities in $XRP’s price structure to a previous bull run, $9.90 looks to be up next,” the post stated.
While other potential targets are plotted above this $9.90 level, the primary focus for many remains on whether XRP can successfully overcome nearby resistance levels and sustain an upward trajectory.
Furthermore, CRYPTOWZRD shared a daily technical update indicating that XRP concluded the session without a definitive directional bias. The token is currently trading near its daily support level. Any upward movement is contingent on Bitcoin’s performance, particularly its market dominance. Resistance is currently observed at $2.75, with support situated around $2.27.
Short-term chart analysis suggests a potential minor dip to $2.3. A subsequent bounce from this level could lead to a price movement towards $2.55. However, a break below the $2.3 mark would signal a bearish outlook.
Large Holders Move Coins to Exchanges
On-chain data reveals that wallets holding over one billion XRP have transferred approximately 1.09 billion tokens since October 16. This activity, as previously reported by CryptoPotato, suggests that large holders might be initiating profit-taking strategies or reducing their overall exposure to the cryptocurrency.
Such significant whale activity often serves as a cautionary signal, especially when accompanied by substantial inflows into exchanges. Traders are closely observing these movements, as they could potentially influence the future price direction of XRP. Concurrently, Ali Martinez noted that the TD Sequential indicator has generated a buy signal on the XRP chart.
“Looks like the rebound is about to begin,” the analyst stated.