
XRP has experienced a notable bounce, mirroring the broader market's recovery. However, it continues to trade as a laggard rather than a leader in the current market sentiment. The recent upward movement was significant enough to trigger a short squeeze and shift market sentiment from extreme fear to a more neutral stance. Despite this, the price is currently encountering resistance at a level where sellers are expected to defend their positions, coinciding with higher-timeframe resistance and key moving averages.
XRP Price Analysis: The USD Chart
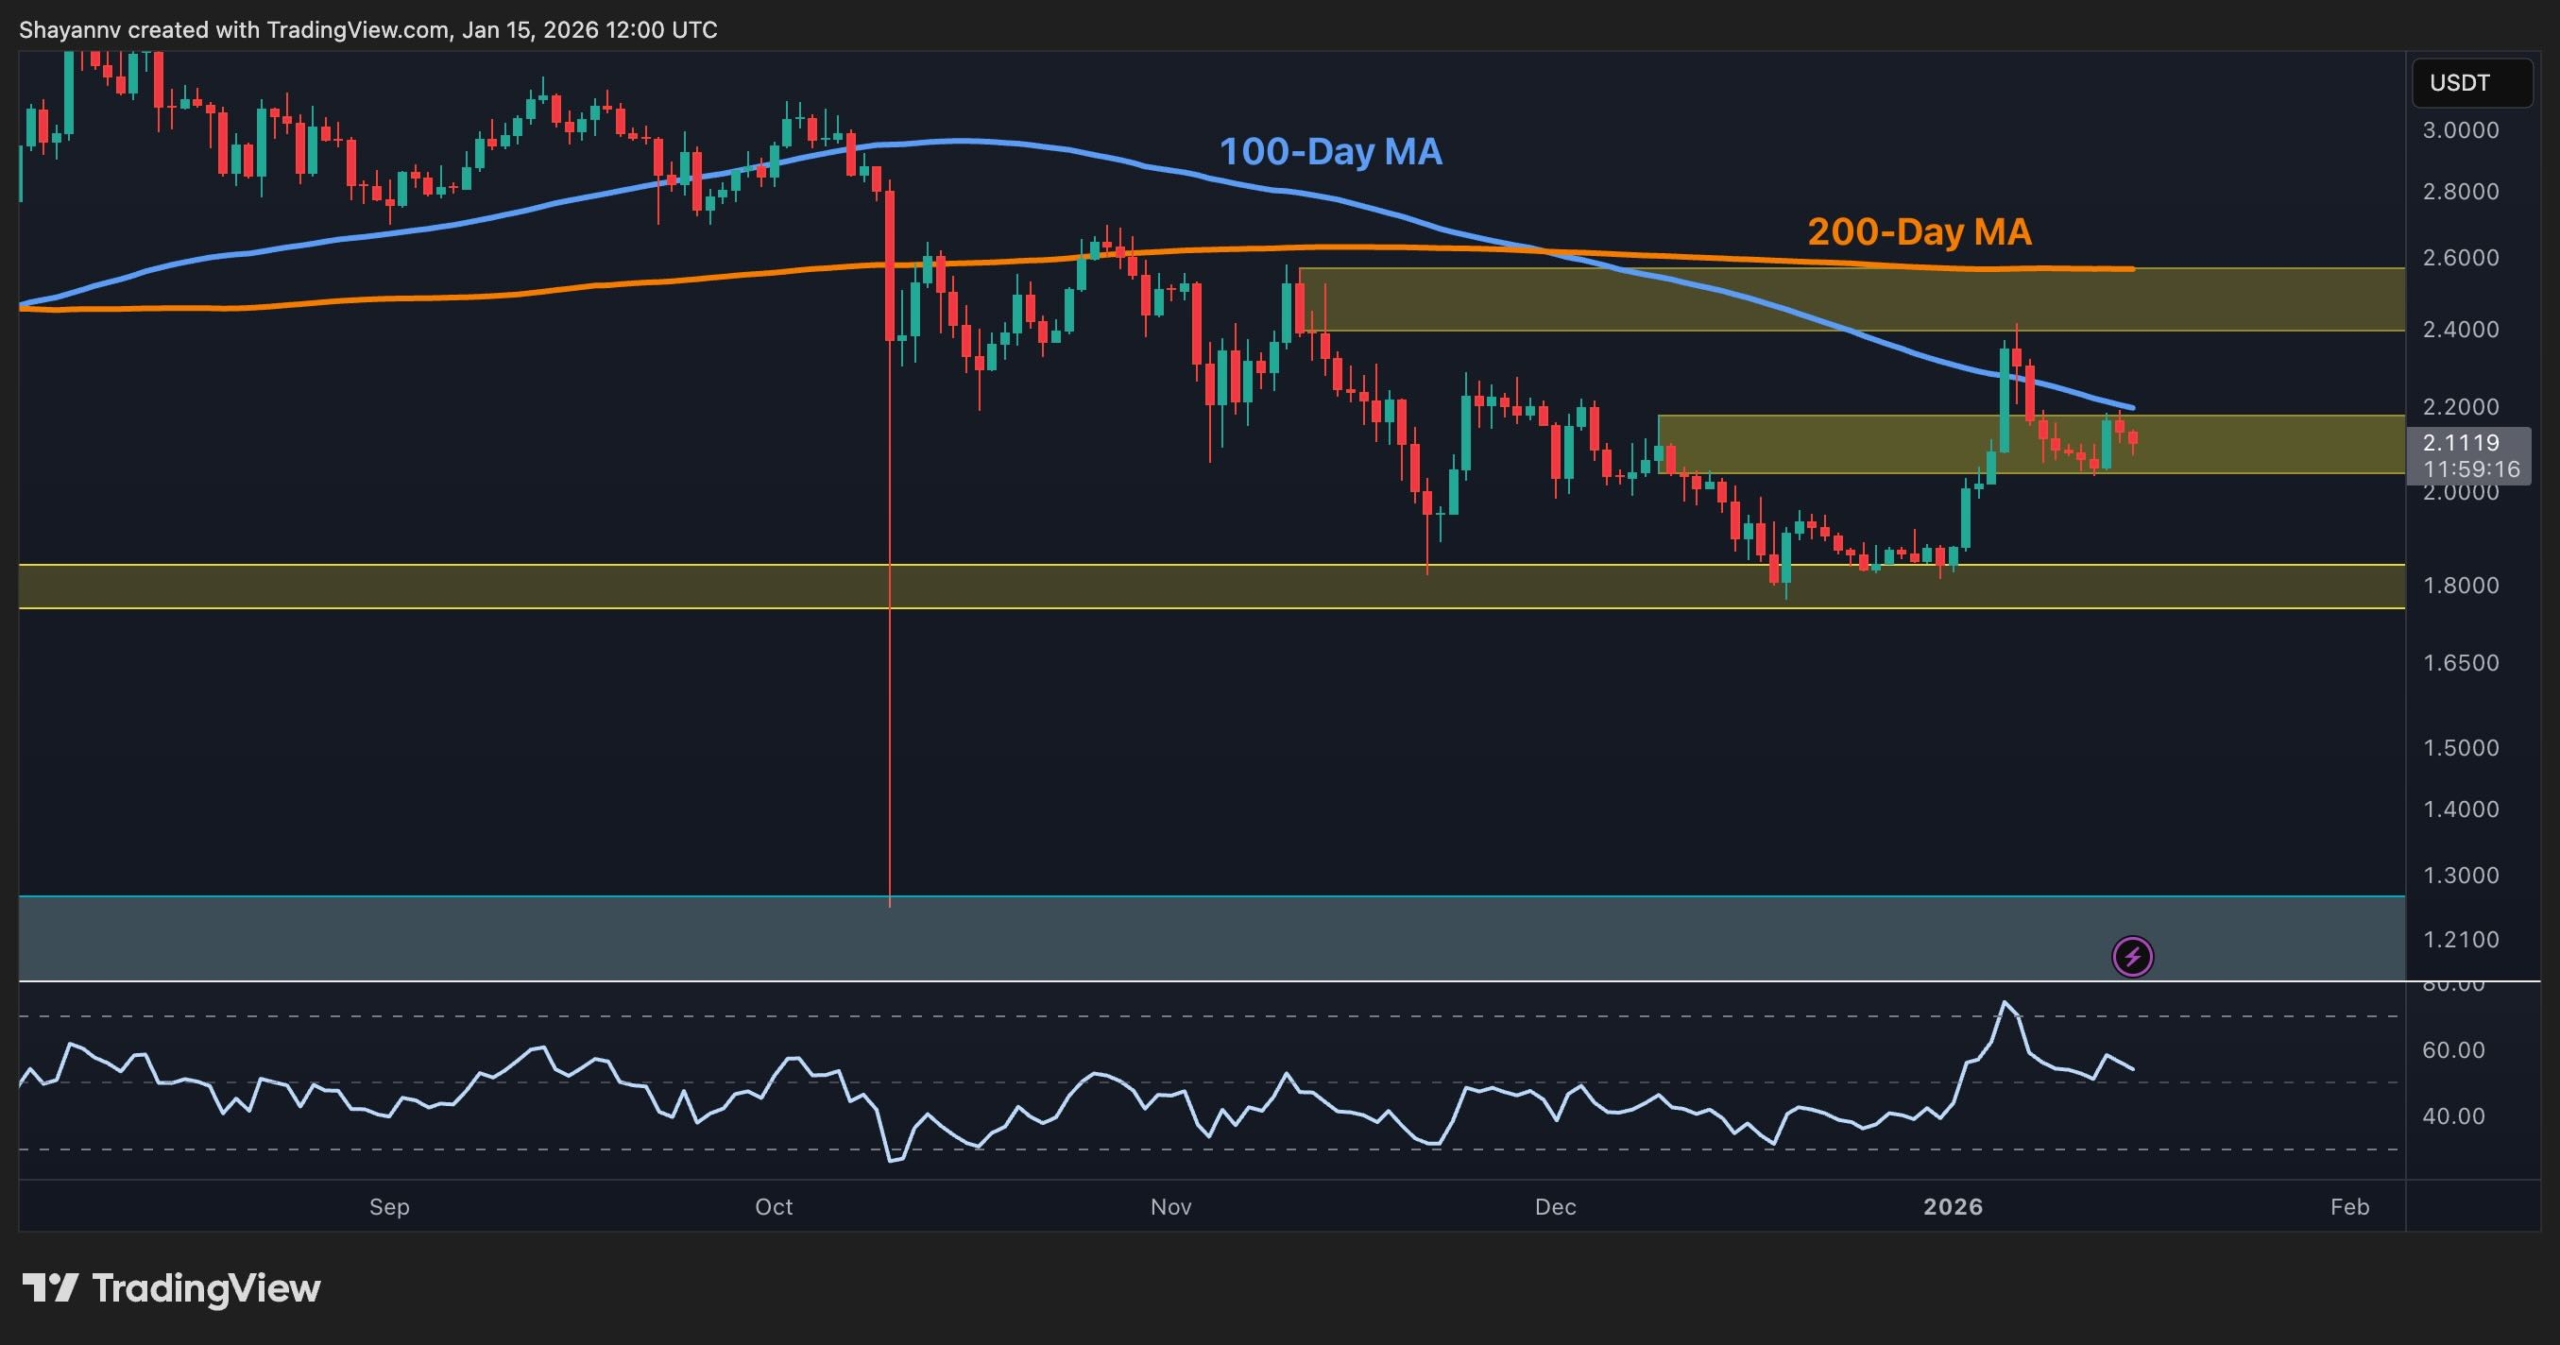
On the daily chart for XRPUSDT, the price has surged into the $2.00 resistance block and is currently facing challenges in maintaining its position above this level. This follows a sharp bounce from the $1.80 demand zone.
The asset recently encountered rejection from the 100-day moving average. Furthermore, the 200-day moving average remains positioned higher, acting as an additional dynamic resistance. These factors indicate that the medium-term structure for XRP remains bearish. The Relative Strength Index (RSI) briefly entered the overbought region and is now showing signs of curling downwards, which aligns with the interpretation of a relief rally encountering a ceiling rather than the commencement of a fresh bullish trend.
Nevertheless, as long as XRP manages to hold within or slightly above the $2.00 area, buyers have grounds to advocate for a period of consolidation before another attempt to breach the critical $2.40 resistance zone. A definitive daily close above this zone would serve as the initial significant indicator of a shift in momentum back in favor of the buyers.
The BTC Pair
When examining the BTC pair, XRP is exhibiting clear underperformance. The price has retraced to approximately 2,180 sats after facing decisive rejection from the 2,500 sats supply zone. XRP also failed to sustain a position above both the 100-day and 200-day moving averages, which have now re-established themselves overhead as resistance elements.
The recent false breakout above the moving averages, followed by a swift sell-off, is a characteristic sign of distribution. Liquidity was effectively captured at higher levels, and the asset was subsequently pushed back into its prior trading range.
For the immediate future, the 2,000 sats area represents the key support level to monitor. As long as this level remains intact, XRP has the potential to continue trading sideways against BTC while it processes the recent price action. Conversely, a strong daily close back above the 100-day moving average, followed by a reclamation of the 2,500 sats area, would be necessary to suggest that XRP is genuinely regaining relative strength against Bitcoin. At present, this scenario appears unlikely.