
Michaël van de Poppe has drawn a comparison between current market conditions and late 2019, a period characterized by a collapse in crypto sentiment and a widespread belief that prices would never recover.
He suggests that SEI is currently in a comparable phase, exhibiting weak price action on charts while experiencing consistent growth within its ecosystem. Historically, such divergences have often preceded significant market reversals.
SEI Price Action Shows Slow Bleed Into Support
Van de Poppe's analysis of the higher-timeframe chart for SEI reveals a prolonged downtrend, marked by the consistent formation of lower highs and lower lows. The price has now reached a broad green support zone situated just above $0.028 to $0.032, an area that has previously acted as a demand zone during multiple pullbacks.
At the end of 2019, it felt like the markets were never going to go up anymore.
That's the same stage right now.
Slow bleed on $SEI, while there's continuous news coming out on the growth of the entire ecosystem.
I don't think it will last staying in these regions for a long… pic.twitter.com/r3TWZw2B3Q
— Michaël van de Poppe (@CryptoMichNL) December 6, 2025
The chart highlights two critical elements:
- •Sustained Downtrend: SEI continues to drift lower without strong impulse moves or significant buyer engagement.
- •Compression into Support: The price is consolidating within a multi-week accumulation zone, indicating a potential slowdown in selling pressure as it approaches a structural floor.
Above this current support region, the chart indicates a distant target zone around $0.66, which corresponds to the upper resistance cluster from earlier in the cycle. Van de Poppe anticipates that SEI will not remain at its current price levels for an extended period, especially if the ecosystem's expansion continues at its present pace.
Short-Term TradingView Chart Shows Stabilization After Sharp Drop
A closer examination of the short-term chart reveals a stabilization pattern following a sharp decline. After falling from the $0.138–$0.140 range down to approximately $0.125, SEI has initiated a small recovery structure.
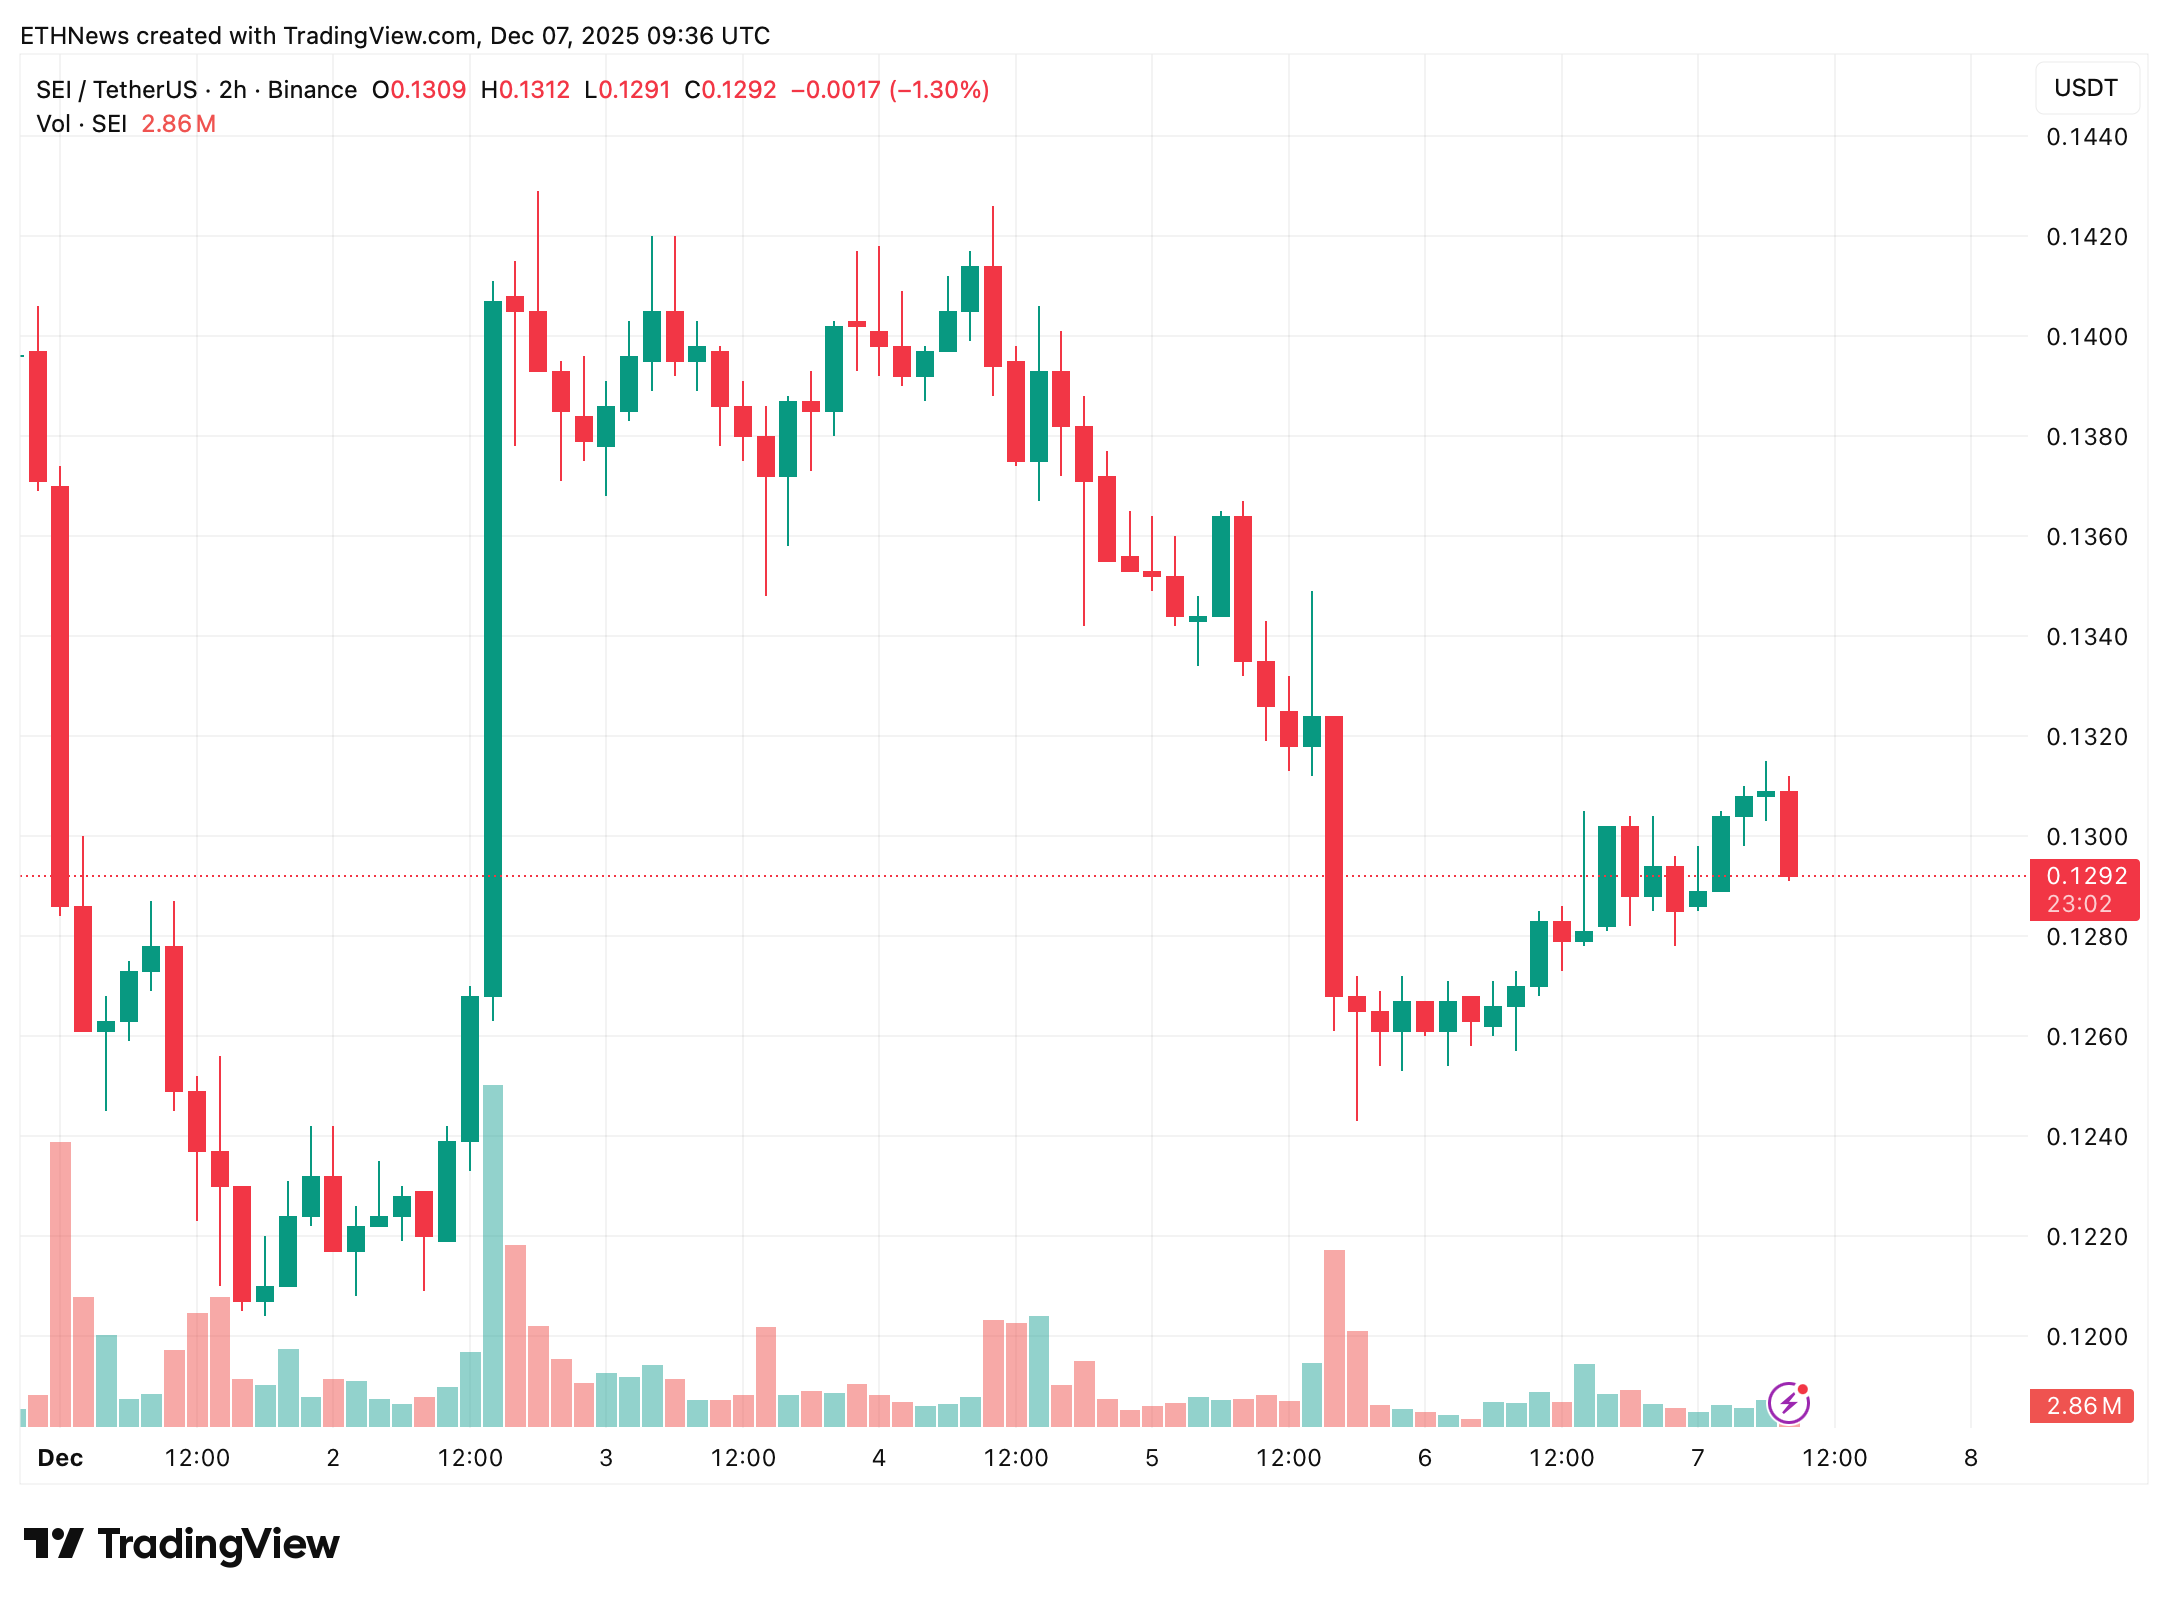
Key observations from this chart include:
- •The price is currently trading at $0.1292, reflecting a 1.30% decrease for the session.
- •The decline experienced in early December led to oversold conditions, which were followed by a clear bounce from the intraday lows.
- •Short-term candles display reduced volatility and tighter consolidation, suggesting a stabilization in order flow after a period of heavy selling.
- •Trading volume appears to be lower compared to the spike observed on December 2, indicating that aggressive sellers may have retreated from the market.
Although a short-term bounce is evident, the overall chart sentiment remains bearish until SEI can reclaim previously broken support levels and establish a pattern of higher lows.
Macro Structure Remains Weak but Near Inflection Point
Van de Poppe's commentary underscores a recurring pattern in the cryptocurrency market: as sentiment reaches its nadir, underlying fundamentals quietly strengthen.
Several factors support this thesis:
- •SEI's ecosystem has consistently announced growth and development, even amidst price weakness.
- •Market participants appear to be experiencing emotional exhaustion, reminiscent of the sentiment in late 2019.
- •Prolonged periods of consolidation near major support levels have historically paved the way for expansions driven by new narratives and ecosystem growth.
Should market sentiment shift, even marginally, SEI could experience a rapid ascent out of its current accumulation range.
Key Levels to Watch
Immediate Support
- •$0.128–$0.126: The current intraday floor.
- •$0.028–$0.032: The major macro support level identified by van de Poppe.
Short-Term Recovery Levels
- •$0.138–$0.140: The first significant resistance level.
- •$0.16: A breakout threshold that would indicate a shift towards bullish momentum.
Mid-to-Long-Term Target
- •$0.66: A major resistance cluster, aligning with previous market structure highs.
Conclusion
SEI continues to experience a slow price bleed, with its value drifting into a multi-month accumulation range. Concurrently, the broader ecosystem is undergoing continuous expansion, mirroring the dynamics observed in 2019 prior to significant market reversals.
Both the higher-timeframe and short-term charts suggest a market under pressure, but also hint at a potential exhaustion of sellers. Unless SEI breaks below its lower support cluster, the current price region may serve as a foundational base for a larger recovery phase.