

Key Insights
- •SOL is retesting a crucial demand zone following a breakout; traders are monitoring the $126 level for potential low-risk entry points.
- •A confirmed trendline breakout above $130 could signal a bullish reversal, provided the demand zone successfully holds as support.
- •While the Relative Strength Index (RSI) is currently near 43, indicating some weakness, the trading setup remains valid if support at the demand zone is maintained and strength is confirmed.
Price Returns to Demand Zone
Solana (SOL) is currently trading around $129.53, with a 24-hour trading volume of $4.48 billion. The price has experienced a nearly 2% decrease in the past day and a more than 8% drop over the last week.
Trader Oxion observed that SOL has broken out of a previous consolidation range and is now experiencing a pullback into a demand zone situated between $126.2 and $128.1. This specific price range aligns with historical support levels and areas of significant trading activity, making it a focal point for traders anticipating a potential price bounce.
"My long area remains 126.2 – 128.1… Waiting for a clean retest of the zone before entering. No chasing, only reactive entries,” Oxion stated. The trader emphasizes a cautious approach, preferring to wait for price action to confirm support within the zone before initiating any long positions, rather than entering prematurely.
The Relative Strength Index (RSI) is currently hovering around 43, which suggests some underlying weakness in the market momentum. However, it has not yet reached oversold territory, leaving room for potential recovery if the identified support levels hold firm.
Trendline Break is Key for Reversal
In a separate analysis, trader1sz highlighted that SOL is currently testing a descending trendline after experiencing a series of lower highs over several weeks. Concurrently, the price is also challenging horizontal support levels near the $129 mark. A potential bullish reversal pattern is beginning to form, which could be confirmed if this trendline is decisively reclaimed with increased buying pressure.
Trader1sz noted, "$SOL at key support. Ideal trigger plan is if we can smash above the trendline and bottom from around here.”
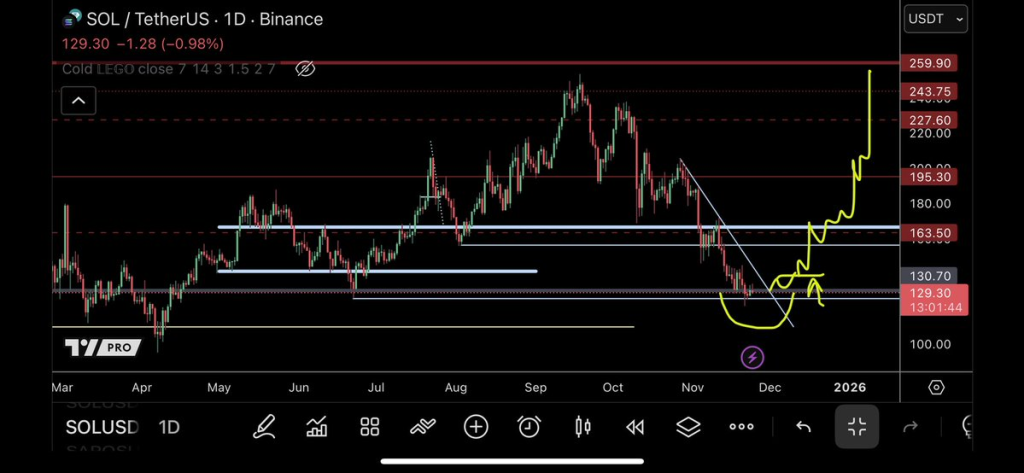
The accompanying chart illustrates a pattern resembling a rounded base formation coupled with a breakout structure. The outlined potential price path includes a retest of the breakout level before a subsequent upward continuation.
Clear Targets Identified If Breakout Confirms
The analysis from trader1sz also maps out several key resistance levels that SOL would need to overcome in the event of a confirmed breakout. The initial significant resistance area is projected to be around $163.50. Following this, further resistance is anticipated at $195.30 and subsequently at $227.60. The upper bounds of the potential range extend to $243.75 and $259.90. These price points correspond with historical highs observed in the market between July and November.
The viability of this bullish outlook is contingent upon SOL successfully reclaiming the descending trendline and maintaining its position above the current demand zone. Without these confirmations, the outlined trading setup is considered inactive.
Setup Depends on Support Holding Firm
The price zone between $126 and $128 is identified as the critical level for Solana's short-term trajectory. If this demand zone successfully holds and shows signs of strength, traders may consider initiating long positions. Conversely, a decisive break below this zone would invalidate the current bullish setup, rendering the proposed trade invalid.
Both analysts are closely monitoring price action for confirmation before committing to any trades, emphasizing a reactive rather than proactive entry strategy.