
Key Market Observations
- •Solana (SOL) has fallen below the $130 support level, with rising trading volume indicating increased selling pressure.
- •The price is now testing the crucial $120–$125 support zone, a level that has historically provided a floor during market downturns.
- •The mid-term ascending channel for SOL remains intact, suggesting that the lower sub-zone of this channel could serve as a base for a potential upward momentum shift.
Solana (SOL) has experienced a significant price decline, breaking below the $130 support level. The cryptocurrency is currently trading around $124.48, accompanied by a notable increase in trading volume, which surged to over $6.18 billion in the last 24 hours. This downturn represents a decline of more than 10% for the day and over 5% for the past week.
The current price action places SOL at a critical juncture, testing the support range between $120 and $125. This area has proven to be a significant psychological and technical support level in previous market corrections. The market is closely observing whether this zone will hold and prevent further price depreciation.
Bearish Signals in Short-Term Charts
Short-term technical indicators suggest continued weakness in Solana's price. The 5, 10, and 20-hour moving averages are all trending downwards and are positioned in a bearish sequence, with the price trading below all three. This configuration confirms ongoing selling pressure in the immediate term.
The Relative Strength Index (RSI) has fallen below the 30 mark, indicating that the asset is in oversold territory. While oversold conditions can sometimes precede a short-term bounce, there are currently no confirmed reversal signals. The Moving Average Convergence Divergence (MACD) indicator shows a bearish crossover, with increasing negative histogram bars, which points to sustained downside momentum for the time being.
Price Tests Key Support Around $125
Market analyst Martini Guy B highlighted the importance of key resistance and support levels for SOL. In a post, he noted, “$SOL needs to break $144 for a potential reversal towards $150–$155. If rejected we could see further downside to $120–$110.” As SOL is currently trading well below the $144 resistance level, the focus remains on the support area near $120.
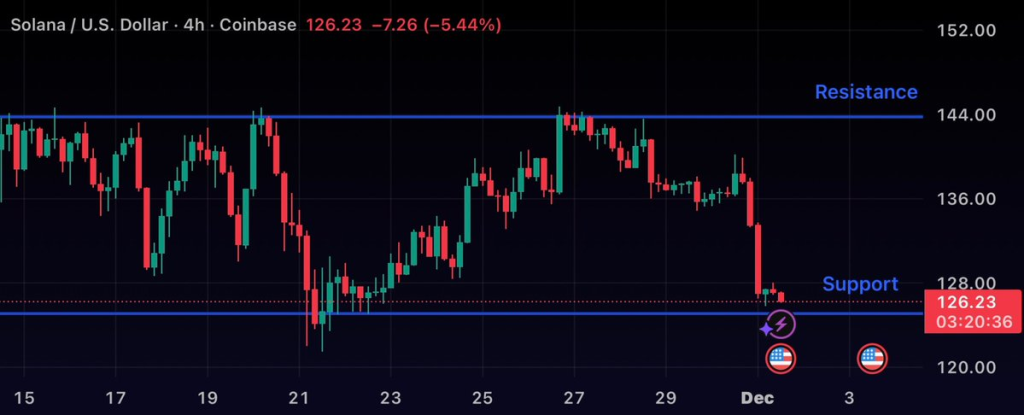
On the 4-hour chart, the RSI is approaching oversold conditions, currently hovering around 36. The MACD indicator is showing signs of flattening, which might suggest a deceleration in the pace of the decline. However, a definitive shift in direction has not yet materialized.
Mid-Term Channel Remains Intact
Despite the recent short-term price breakdown, the broader mid-term market structure for Solana remains unchanged. Trader Tardigrade pointed out that SOL continues to trade within a significant rising channel that began in May 2022.
Tardigrade stated, “It is currently in the lowest sub-channel zone… an upward momentum trigger could push it above $1,500.”
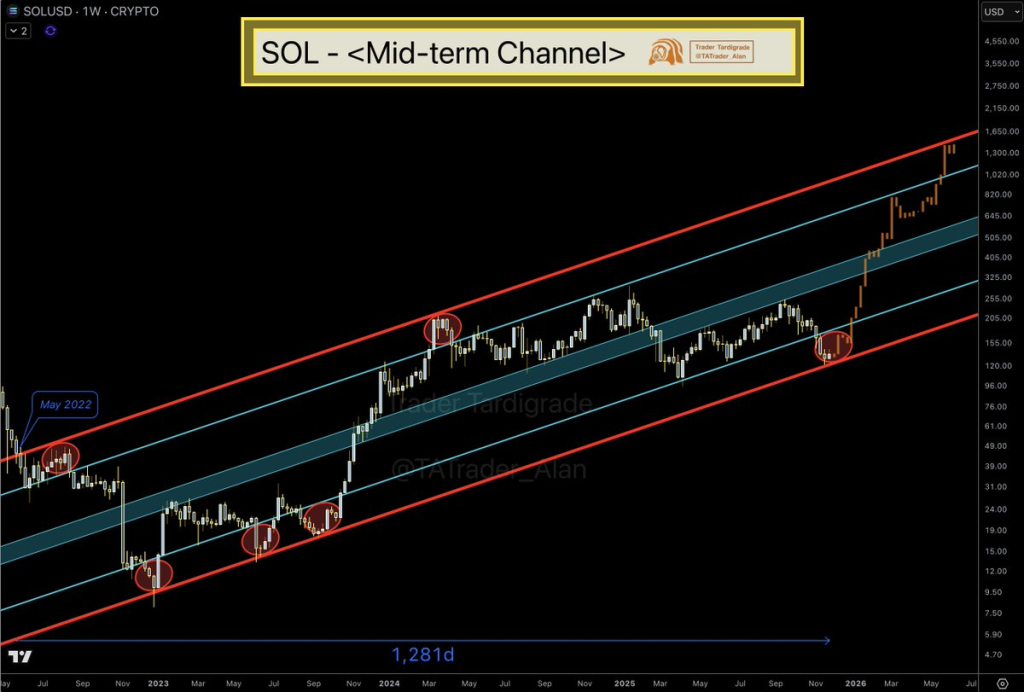
The lower boundary of this established channel has historically served as a reliable support level on multiple occasions. SOL is once again approaching this critical area, and the overall structure of the channel remains intact as long as this level is defended.
Sentiment Weakens Amidst Volume Spikes
The recent sell-off in SOL has drawn increased attention to the cryptocurrency, making it one of the most discussed assets on various crypto platforms.
gemxbt reported on the market sentiment, stating, “$SOL is experiencing strong downward momentum… breaking below the $130 support level.”
With SOL's price situated near a significant decision point, traders are keenly observing whether buying interest will return to the market. If the current support levels hold, a short-term price rebound is possible. Conversely, a failure to maintain these levels could lead to further downward price action, with targets between $120 and $110 coming into focus.