
Key Insights
- •SOL is trading within the $136 to $142 range, with momentum indicators suggesting a potential shift in direction.
- •The price has maintained its position above a descending trendline, while an ascending trendline provides short-term upward bias.
- •A sustained break above $142 with increased volume is necessary to target $171; otherwise, a revisit of lower support zones is possible.
Price Holding in Tight Range
Solana (SOL) is currently consolidating within a narrow range, fluctuating between $136 and $142. The price stands at $141.00, reflecting a minor 0.2% decrease over the past 24 hours, yet showing a significant 13.6% increase over the last seven days. This price action is closely monitored by traders anticipating the next directional move.
On the 1-hour chart, SOL is testing short-term resistance at $142 and support near $136. This consolidation follows a recent upward movement and indicates a period of equilibrium before a potential breakout or pullback. The price remains above the mid-range, suggesting underlying strength.
Short-term moving averages, including the 5-period, 10-period, and 20-period moving averages, are closely aligned. This alignment typically signifies a period of low volatility, often preceding a more significant market move. The current setup suggests that the market is poised for a breakout or a reversal, contingent on how price interacts with these critical levels.
Indicators Mixed, Market Awaits Clarity
Momentum indicators are currently neutral, with the Relative Strength Index (RSI) hovering around the 50 mark, indicating neither strong buying nor selling pressure. However, the Moving Average Convergence Divergence (MACD) is showing signs of turning upward. The MACD line is approaching a potential crossover above the signal line, and the shrinking histogram bars suggest that bearish momentum may be waning.
An increase in buying pressure, confirmed by a MACD crossover, could lead to a positive shift in short-term momentum. Trading volume remains steady but has not reached levels that would indicate strong conviction from traders, suggesting they are awaiting further confirmation.
Breakout on Higher Timeframe
On the 4-hour chart, SOL has successfully broken above a descending trendline, which is a potential signal of a short-term directional change. Furthermore, the price is maintaining its position above an upward-sloping support line. As long as this ascending trendline holds, further upward movement remains plausible.
Analyst Man of Bitcoin observed, stating:
“As long as it holds support on the ascending trendline, a direct move higher remains likely.”
However, the analyst also cautioned:
“The structure still appears correct, which leaves the door open for another low at this stage.”
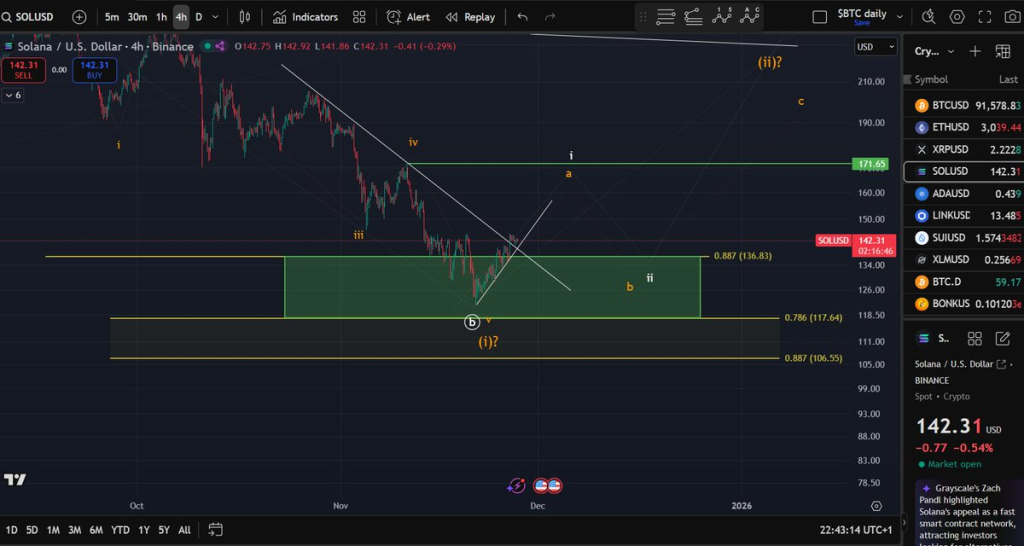
The current chart structure suggests that the price action might still be part of a larger corrective phase. If current support levels fail, the price could retrace to the support zones identified between $117.64 and $106.55.
Traders Watch the $142 Level
A decisive move above the $142 resistance level, accompanied by an increase in trading volume, could pave the way for SOL to target the $171.65 level. Until such a breakout occurs, the price is expected to remain within this critical zone. The current pattern indicates market indecision, and the immediate future direction will depend on the price's ability to sustain current support or break through key resistance levels in the upcoming trading sessions.