
Key Market Insights for Solana (SOL)
- •$148 represents a dense short liquidity zone; a breakout above this level could trigger significant liquidations and rapid price acceleration.
- •The $130 level is identified as critical support; holding this price point maintains the possibility of achieving higher long-term price targets.
- •A breakdown below $130 could expose Solana to price declines toward the $70-$80 range, with a potential shakeout below $100 preceding such a move.
Recent analysis of order book data reveals a substantial cluster of liquidity forming near the $148 mark for Solana (SOL). This area is characterized by a dense concentration of stop orders and high-leverage short positions, as indicated by liquidity heatmaps.
Solana has been trading within a constrained range, fluctuating between $137 and $143 since its decline from levels above $150. Traders are keenly observing the $148 level, as a sustained push towards this price point could initiate the liquidation of existing short positions.
“if $SOL rises to just $148, most high leverage short positions will be liquidated.”
If this liquidation level is reached, it could serve as a catalyst for a rapid upward price movement, commonly known as a short squeeze.
$130 Demand Zone Marks a Critical Support Area
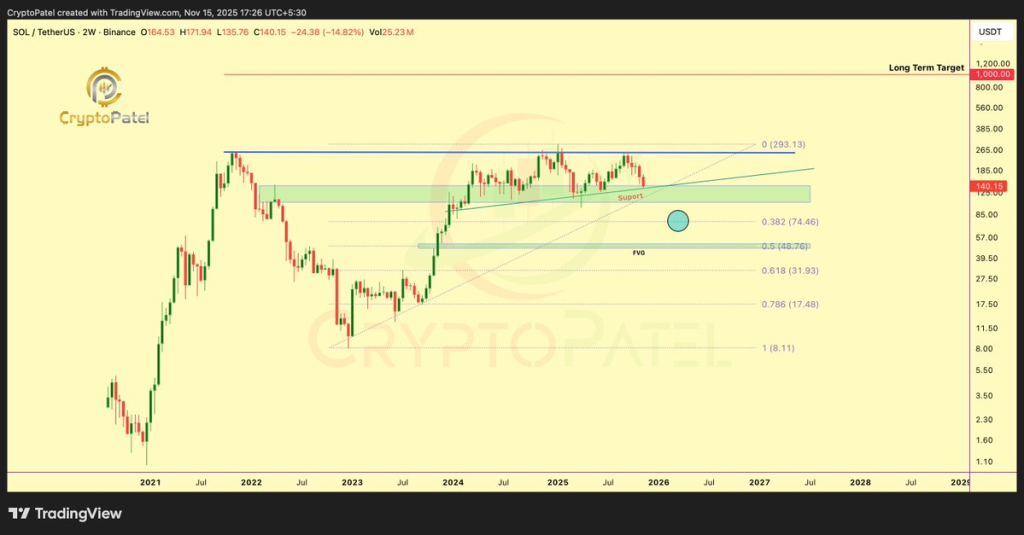
A broader market chart shared by CryptoPatel highlights a significant support zone located at $130. Solana is currently trading just above this level, which also coincides with previous accumulation areas and trendline support. The market has shown responsiveness to this zone on multiple occasions, making it a focal point for traders monitoring longer-term trends.
If this support level continues to hold firm, a potential move towards $185 becomes a viable prospect. The chart also indicates extended targets reaching as high as $293, based on historical price fluctuations. Long-term projections suggest the possibility of a more substantial upward trend, with Fibonacci extension levels pointing to potential ranges between $500 and $1,000. These extended targets are derived from earlier trend reversals and are utilized to estimate possible price expansion over time.
Break Below Support Could Open Lower Price Zones
In the event that the $130 support fails to hold, the next potential area for price stabilization is identified between $70 and $80. This range aligns with key Fibonacci retracement levels, specifically the 0.382 and 0.5 marks, which are commonly used to pinpoint potential pausing or reversing points for price corrections. CryptoPatel noted, “a wick under $100 would be a classic shakeout before the next macro leg,” suggesting the possibility of a swift price drop followed by a subsequent recovery.
Furthermore, there is an identified zone between $40 and $50 labeled as a Fair Value Gap. This level might attract price attention if the decline extends significantly, though it is not anticipated unless broader market conditions experience a notable weakening.
Current Price and Trading Volume
Solana was priced at $142.01, with a 24-hour trading volume of $3.38 billion. The price has seen a decrease of 0.2% over the last 24 hours and a 10.3% drop over the past 7 days. Market participants are closely monitoring the $130 support and $148 resistance levels, as a decisive movement through either of these points could lead to heightened volatility and a shift in the short-term price direction.