

SOL has confirmed a significant trendline breakout, with retest activity forming a stable structure for buyers. Funding data remains neutral during a broad decline, indicating balanced futures positioning. The price is holding above reclaimed resistance, and traders are monitoring the next liquidity zone for further movement.
SOL shows a clear structural shift after breaking a major descending trendline, while funding levels remain stable. Traders are observing price behavior as the asset establishes a new support structure following recent confirmation.
SOL Major Trendline Breakout Confirmed
SOL reacted to a major development after Captain Faibik shared a 2-hour chart analysis. The post indicated that the breakout and retest were confirmed, signaling a strong shift in market structure. This significant move follows a period of weeks where the asset was trading under a dominant descending trendline.
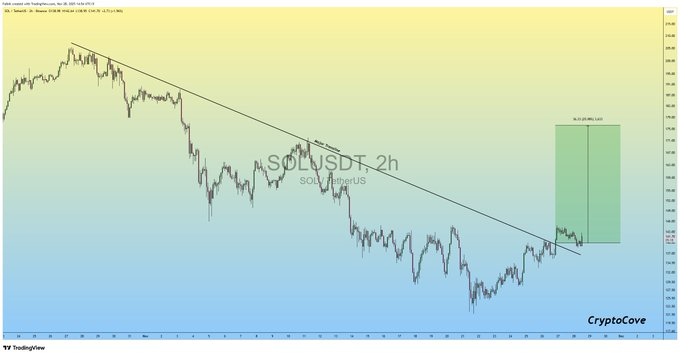
The chart illustrates how the trendline guided a prolonged sequence of lower highs. Each attempt to reclaim this line resulted in rejection, pushing the price back into lower support levels. The extended nature of this pattern highlights how the market respected the structure, lending added importance to the recent breakout.
SOL eventually formed a rounded bottom across its lower range before breaking above resistance. The breakout was characterized by control and firmness, refuting any notion of a weak push through the trendline. A clean retest subsequently occurred, successfully turning the former resistance into a new support level for the pair.
SOL Price Behavior After the Retest
As of writing, SOL is trading at $137.48, reflecting a 1.70% decline over the past 24 hours. However, the asset still shows a 7-day gain of 9.34%, indicating improved momentum following the structural shift. The chart analysis suggests that buyers are actively working to maintain control above the reclaimed zone.
The local candle movements observed after the retest indicate steady continuation without abrupt selling pressure. These patterns suggest that the market has accepted the breakout level as support. The structure remains stable, with price beginning to form a controlled upward sequence above the trendline.
A green projection box is visible on the right side of the chart, outlining a potential 28% move toward the next liquidity region. This projection aligns with the structure formed after the breakout and serves as the next directional focus for traders.
Funding Rate Data Shows Controlled Conditions
The SOL OI-Weighted Funding Rate chart displays activity from late August to late November. Throughout most of this period, funding rates remained close to neutral, indicating balanced positioning across the futures market. This pattern persisted even during periods of sharp price movements.
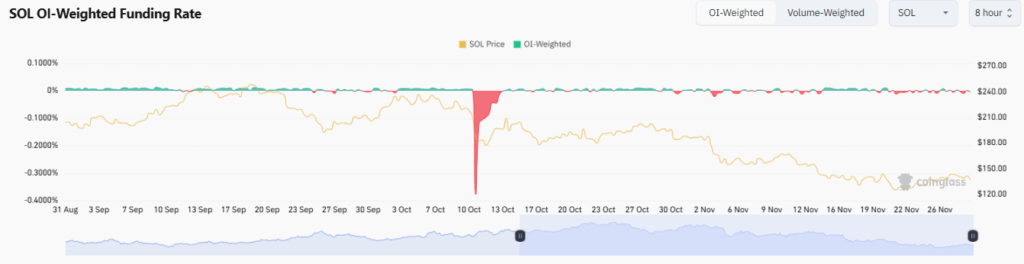
A key observation occurred on October 3, when SOL traded around $229 with a funding rate of 0.0044%. This low positive value signifies reduced speculative activity near the range's peak. It suggests that futures traders were neither heavily long nor heavily short at that particular time.
As the price declined from the $220–$240 zone to the $150 area, funding rates remained mixed. Short-lived negative readings appeared but were consistently shallow. This data suggests controlled market conditions without significant leverage exposure, allowing price movements to be driven primarily by spot activity.