

Solana has experienced significant downward pressure throughout November, but recent data indicates a potential shift in this trend. The asset is currently trading around $127, continuing a multi-week decline that has seen SOL fall nearly 50% from its September peak. Despite this drawdown, emerging on-chain metrics and short-term forecasts suggest early signs of improving momentum.
Solana Price Prediction Points to Short-Term Recovery
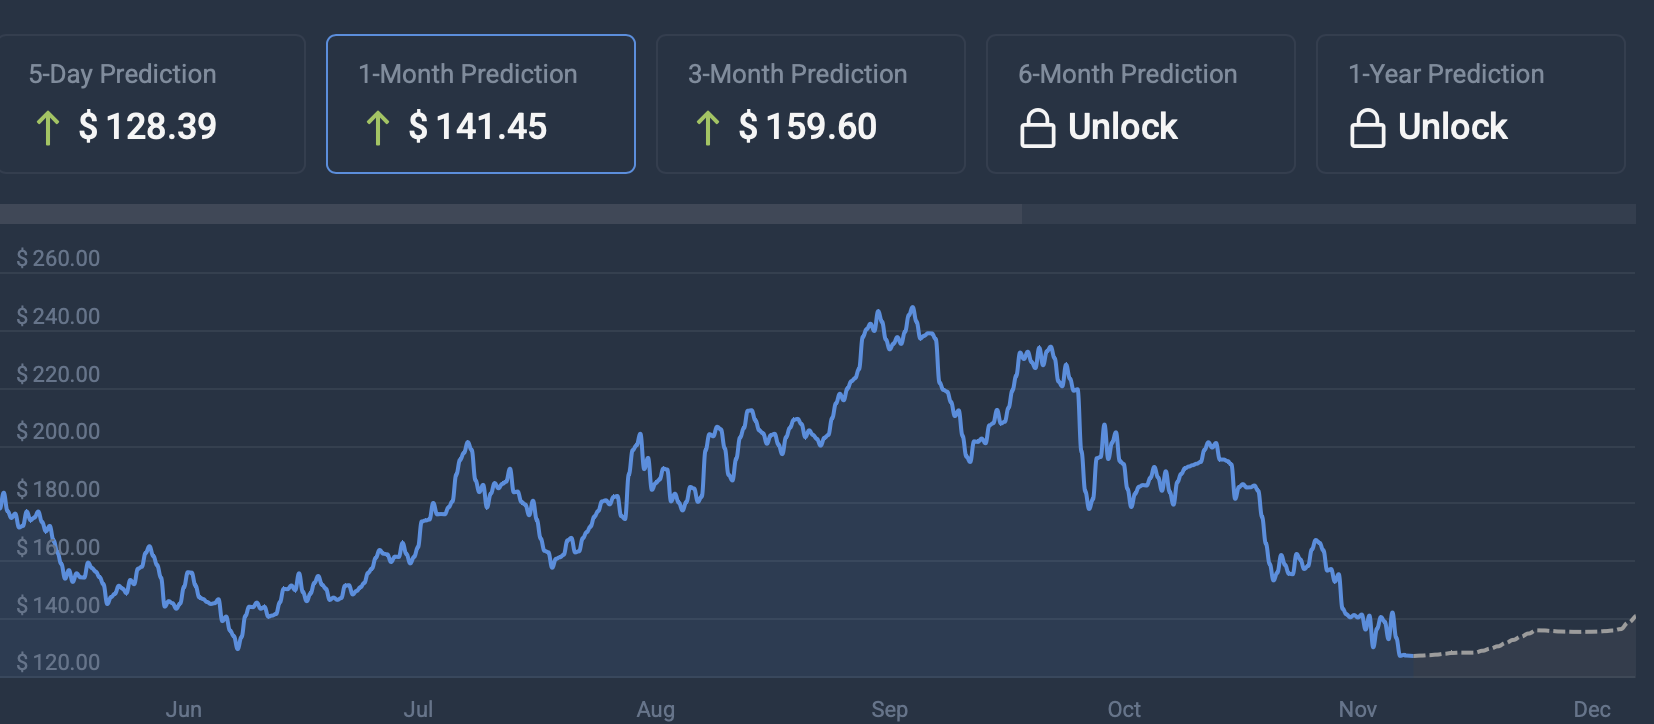
According to available data, Solana's short-term technical outlook appears slightly more optimistic than current market sentiment might suggest. CoinCodex's 30-day model forecasts a potential move towards $141.45, representing an increase of approximately 10.83% from its current level of $127.
SOL is currently in a high-volatility phase, with its volatility standing at 13.47%. Both the 50-day Simple Moving Average (SMA) at $179.43 and the 200-day SMA at $174.92 are positioned significantly above the spot price, which typically signals a broader downtrend. The Fear & Greed Index reading of 11, indicating "Extreme Fear," reflects conditions often seen near local market bottoms, suggesting potential capitulation.
Concurrently, the Relative Strength Index (RSI) at 31.19 suggests that the asset is approaching oversold territory, which strengthens the probability of a corrective upward movement.
Santiment: “Unique Bullish Divergence” Emerges
New on-chain data from Santiment highlights a significant divergence developing within Solana's network activity. Despite SOL's -49% decrease from its local high on September 17, Santiment reports:
- •Daily active addresses are showing an upward trend.
- •The creation of new SOL wallets is also trending upwards.
- •Interaction levels with the network are increasing.
Solana's market value has now fallen -49% from its local top back on September 17th. However, there has been a unique bullish divergence with crypto's #7 market cap. The amount of interacting addresses are rising, and new $SOL wallet creation is trending up.
Follow the…
November 22, 2025
The analytics firm describes this pattern as a "unique bullish divergence" for the cryptocurrency ranked seventh by market capitalization. This indicates that network activity is improving even as the price is declining. Historically, such divergences have often preceded a shift in momentum once selling pressure subsides. The accompanying chart illustrates a sustained downtrend in address activity that is now breaking upward, with new addresses increasing even as the price continues to fall – a classic signal of an early-cycle reversal.
TradingView Chart Shows Heavy Selling Followed by Volume Expansion
Analysis of the 4-hour TradingView chart reveals a distinct downtrend that began in early November. However, the most recent 48 hours show a notable surge in trading volume.
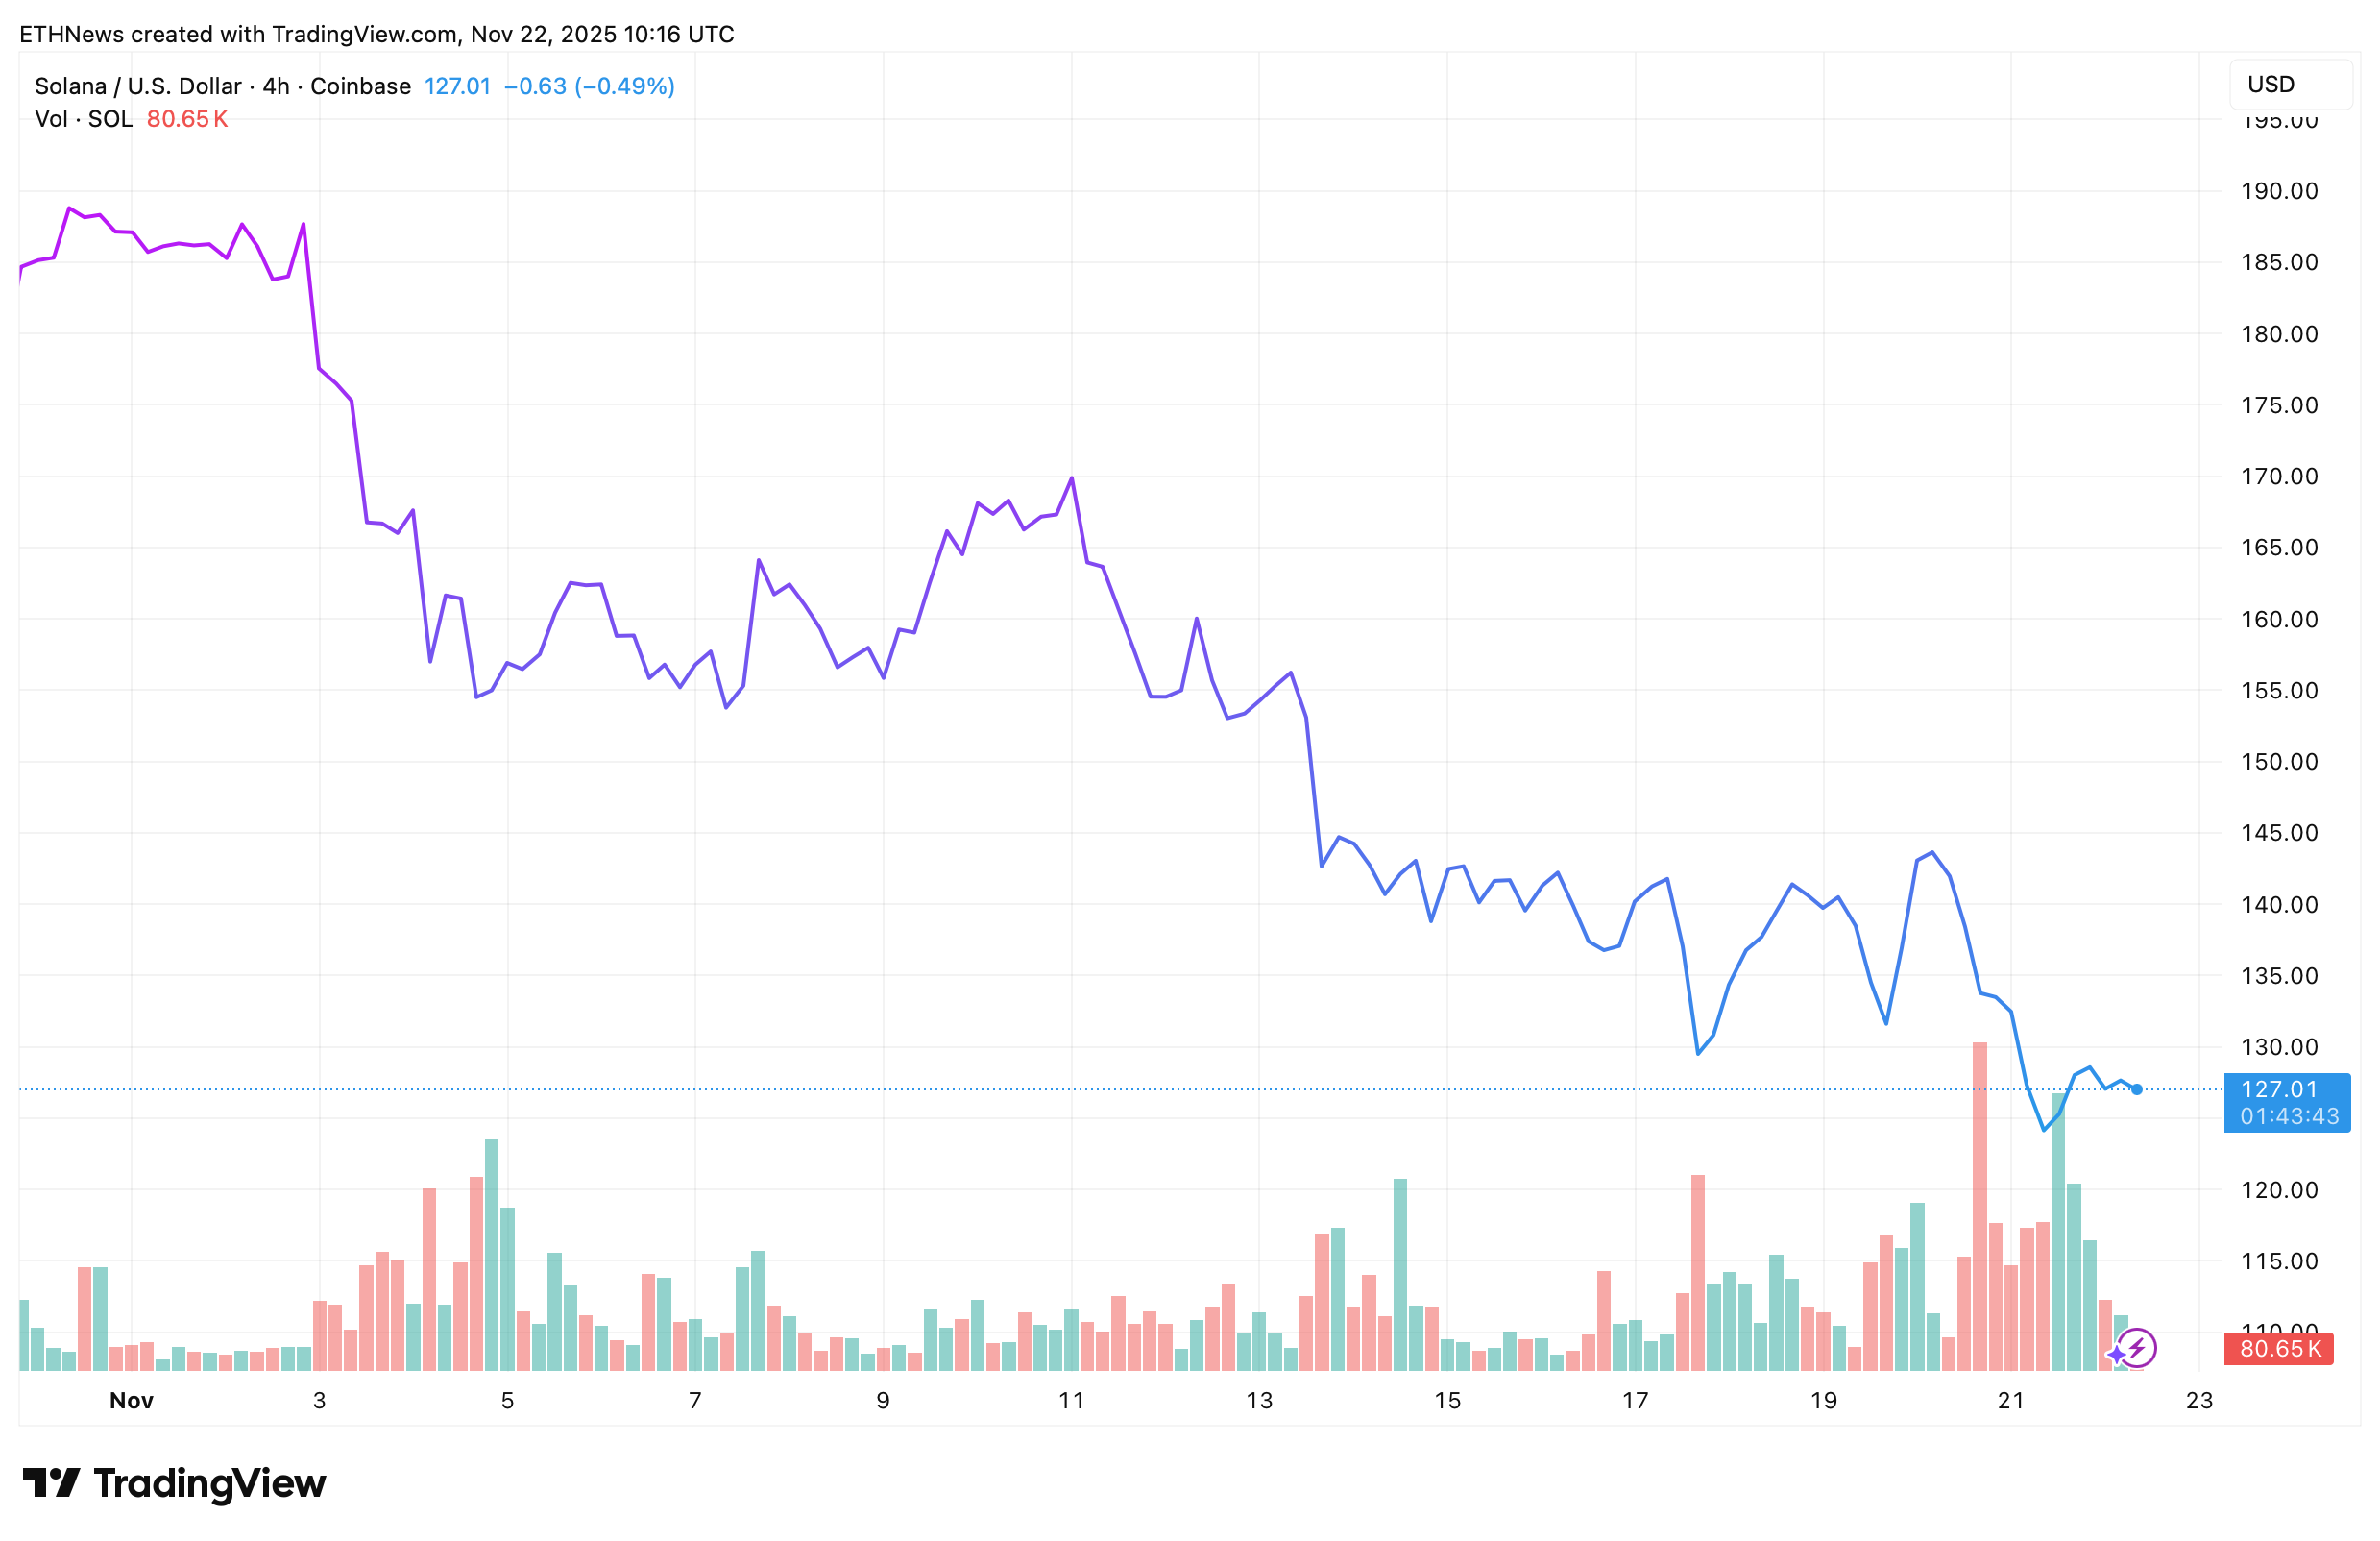
Buyers have demonstrated aggressive participation in the $120–$125 price zone, leading to the formation of several significant green candles that have helped stabilize the price near its current level. This behavior on the lower timeframe suggests that liquidity is returning to the market after an extended period dominated by sellers.
Outlook
Solana continues to face broader technical pressure in the market. However, the combination of strengthening on-chain activity, oversold technical indicators, and CoinCodex's short-term price target of $141.45 provides traders with compelling reasons to monitor the asset closely.
Should address growth continue to accelerate and trading volume remain elevated, SOL may initiate a corrective rally. This rally could potentially target the mid-$130s and possibly reach the projected $141 level in the coming weeks.