

Solana is currently attempting to maintain its position around the $127 mark. This region is characterized by strong liquidity in both spot and derivatives markets, with buyers and sellers engaging in high-volume activity despite price compression. This indicates a balanced, yet potentially fragile, market environment where shifts in flows can significantly influence direction.
Derivatives data reveals an increase in leverage, evidenced by rising open interest across major futures platforms. This structure heightens volatility risk, making Solana more susceptible to liquidation cascades. Traders are advised to closely monitor the evolution of leverage, as it could accelerate market movements.
Real-time indicators such as the Long Short ratio, Netflows, and Funding rate provide crucial signals about market momentum. These indicators help assess whether buyers are strengthening their position or losing control, which is vital for predicting potential reversals or further consolidation.
Key Highlights:
|
Technical and Market Structure Overview
| Metric | Value |
|---|---|
| Price (Spot) | 127.40 USD |
| Market Cap | 71.48B USD |
| Circulating Supply | 559.65M SOL |
| Total Supply | 615.20M SOL |
| 24h Spot Volume | 1.23B USD |
| 24h Futures Volume | 14.19B USD |
| Open Interest (Futures) | 6.63B USD |
| CoinGlass data indicates strong participation in both spot and derivatives markets. Despite price compression, liquidity and leverage remain elevated, conditions often preceding a decisive increase in volatility. |
Derivatives Liquidity and Open Interest Dynamics
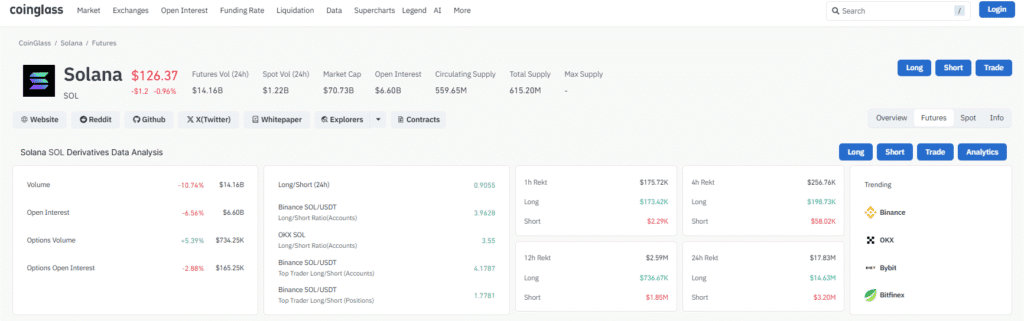
The volume of futures trading in the last 24 hours reached $14.19B, reflecting significant participation. Open interest is close to $6.63B, signifying substantial leverage across platforms. Markets with high open interest typically exhibit sharp reactions to even minor price changes.
Spot Liquidity and Circulation Health
Spot volume, near $1.23B, confirms strong underlying demand. Active spot market participation helps support the price, especially when derivatives markets face pressure. High spot liquidity often acts as a buffer against significant intraday price drops.
The circulating supply stands at 559.65M SOL, with a total supply of 615.20M SOL. This narrow gap suggests a low dilution risk and a stable distribution of tokens. Markets with consistent supply levels tend to form firmer price bases.
The combination of spot activity and stable tokenomics contributes to Solana's balance during consolidation periods. These conditions enhance the probability of a swift recovery once market sentiment turns positive.
On-chain and Spot Flow Signals from CoinGlass
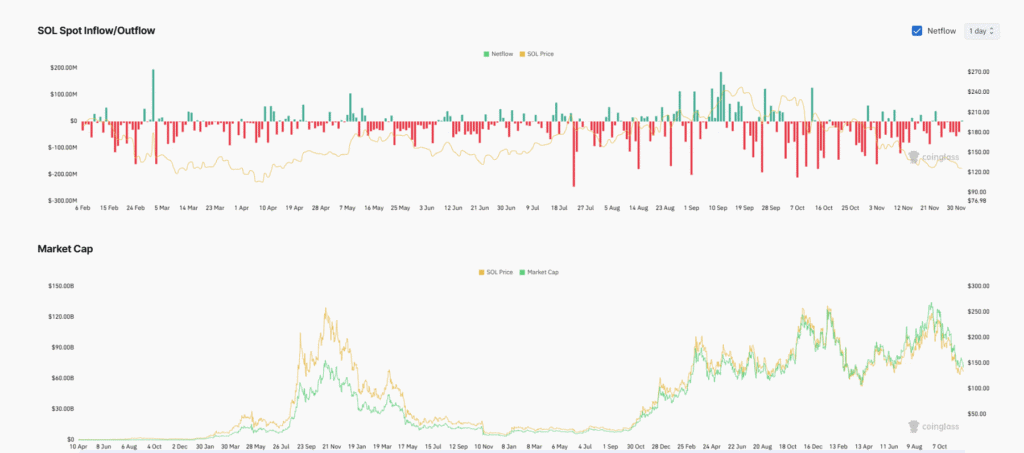
The Spot Netflow charts show several sessions of negative flow, indicating persistent selling pressure. Red bars at key levels represent capital leaving exchanges, with occasional green inflows appearing to stabilize the price.
Clusters of negative Netflow typically coincide with price declines, confirming that spot outflows are a significant driver of trend direction. Solana often experiences bounces when the Netflow turns positive. These changing flows signal a lack of dominance by either buyers or sellers.
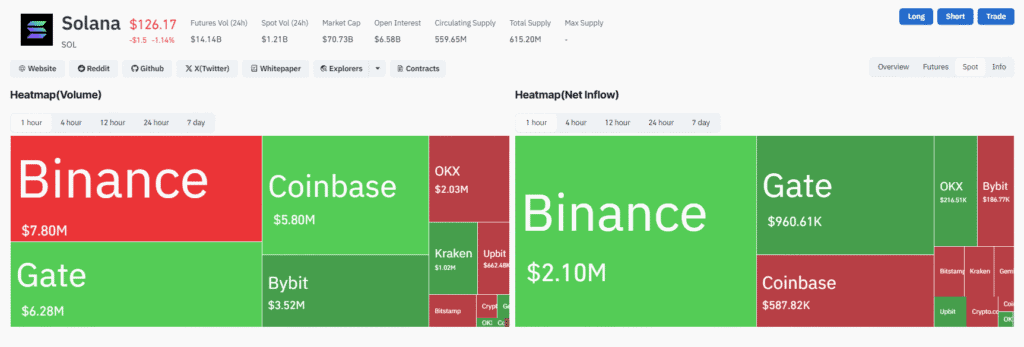
The Volume Heatmap shows Binance at $7.80M USD, Gate at $6.28M USD, and Coinbase at $5.80M USD, reflecting strong liquidity across major exchanges. The Net Inflow Heatmap highlights Binance with $2.10M USD, Gate with $960.61K USD, and Coinbase with $587.82K USD, suggesting confident accumulation.
Market capitalization is keeping pace with price action, indicating real participation rather than volatility driven by thin order books. The stability of market cap during pullbacks attests to genuine demand and increases the likelihood of a reversal. This sustained capitalization suggests ongoing market interest in Solana beyond speculative trading.
Additional Perspective of Market Risks and Supportive Factors
Solana is positioned at a critical juncture where leverage-driven risk intersects with spot-driven stability. For traders, understanding the interplay of these forces is paramount, as short-term positioning can be heavily influenced by their balance. Even minor shifts in liquidity or sentiment can immediately impact price direction.
High open interest further elevates the risk of liquidation cascades forming during sudden price dips. When the price compresses within a tight range, forced selling can rapidly accelerate, creating an environment where Solana becomes more sensitive to unexpected volatility events across the broader market.
Larger market swings often indicate increased activity in Solana's derivatives markets and a squeeze on leveraged positions. As these positions unwind, the market typically gravitates towards local support levels. Reducing excessive leverage becomes essential during periods of market stress.
Spot liquidity generally acts as a stabilizing factor when derivatives pressure intensifies. Strong inflows help absorb downside shocks, while stable tokenomics mitigate dilution risk. When demand improves, spikes in spot volume often precede short-term reversals, offering early directional signals.