
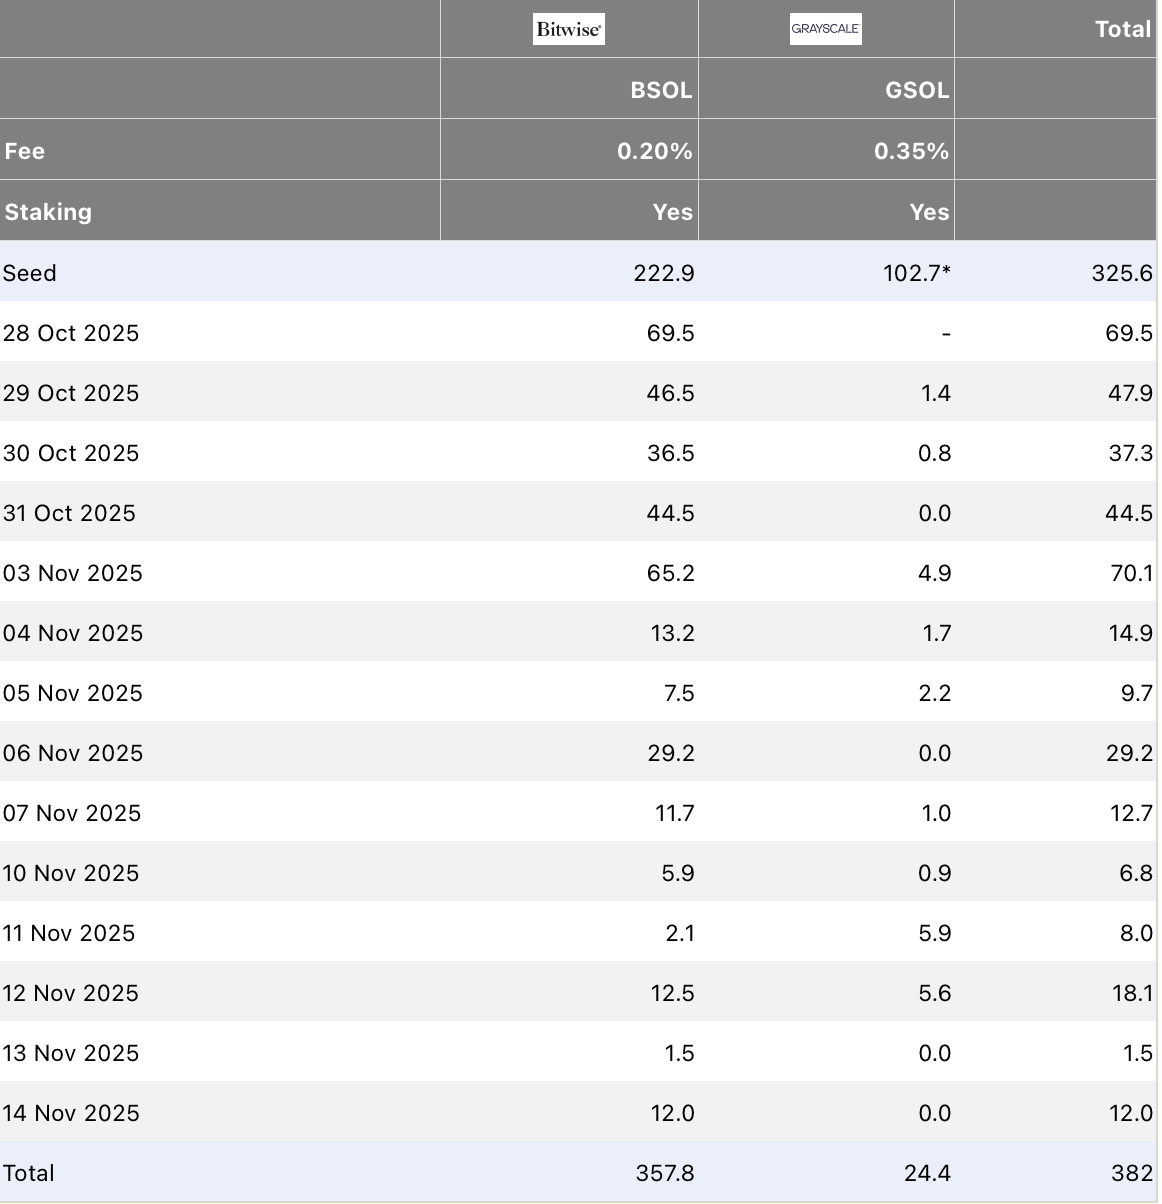
Solana (SOL) is firmly under pressure this week, sliding to its lowest level in five months despite a rare streak of 13 consecutive days of positive ETF inflows. The price has failed to respond to the nearly $380 million in institutional demand, exposing a widening gap between ETF activity and real spot-market sentiment.
Solana’s Price Struggles Despite ETF Inflows
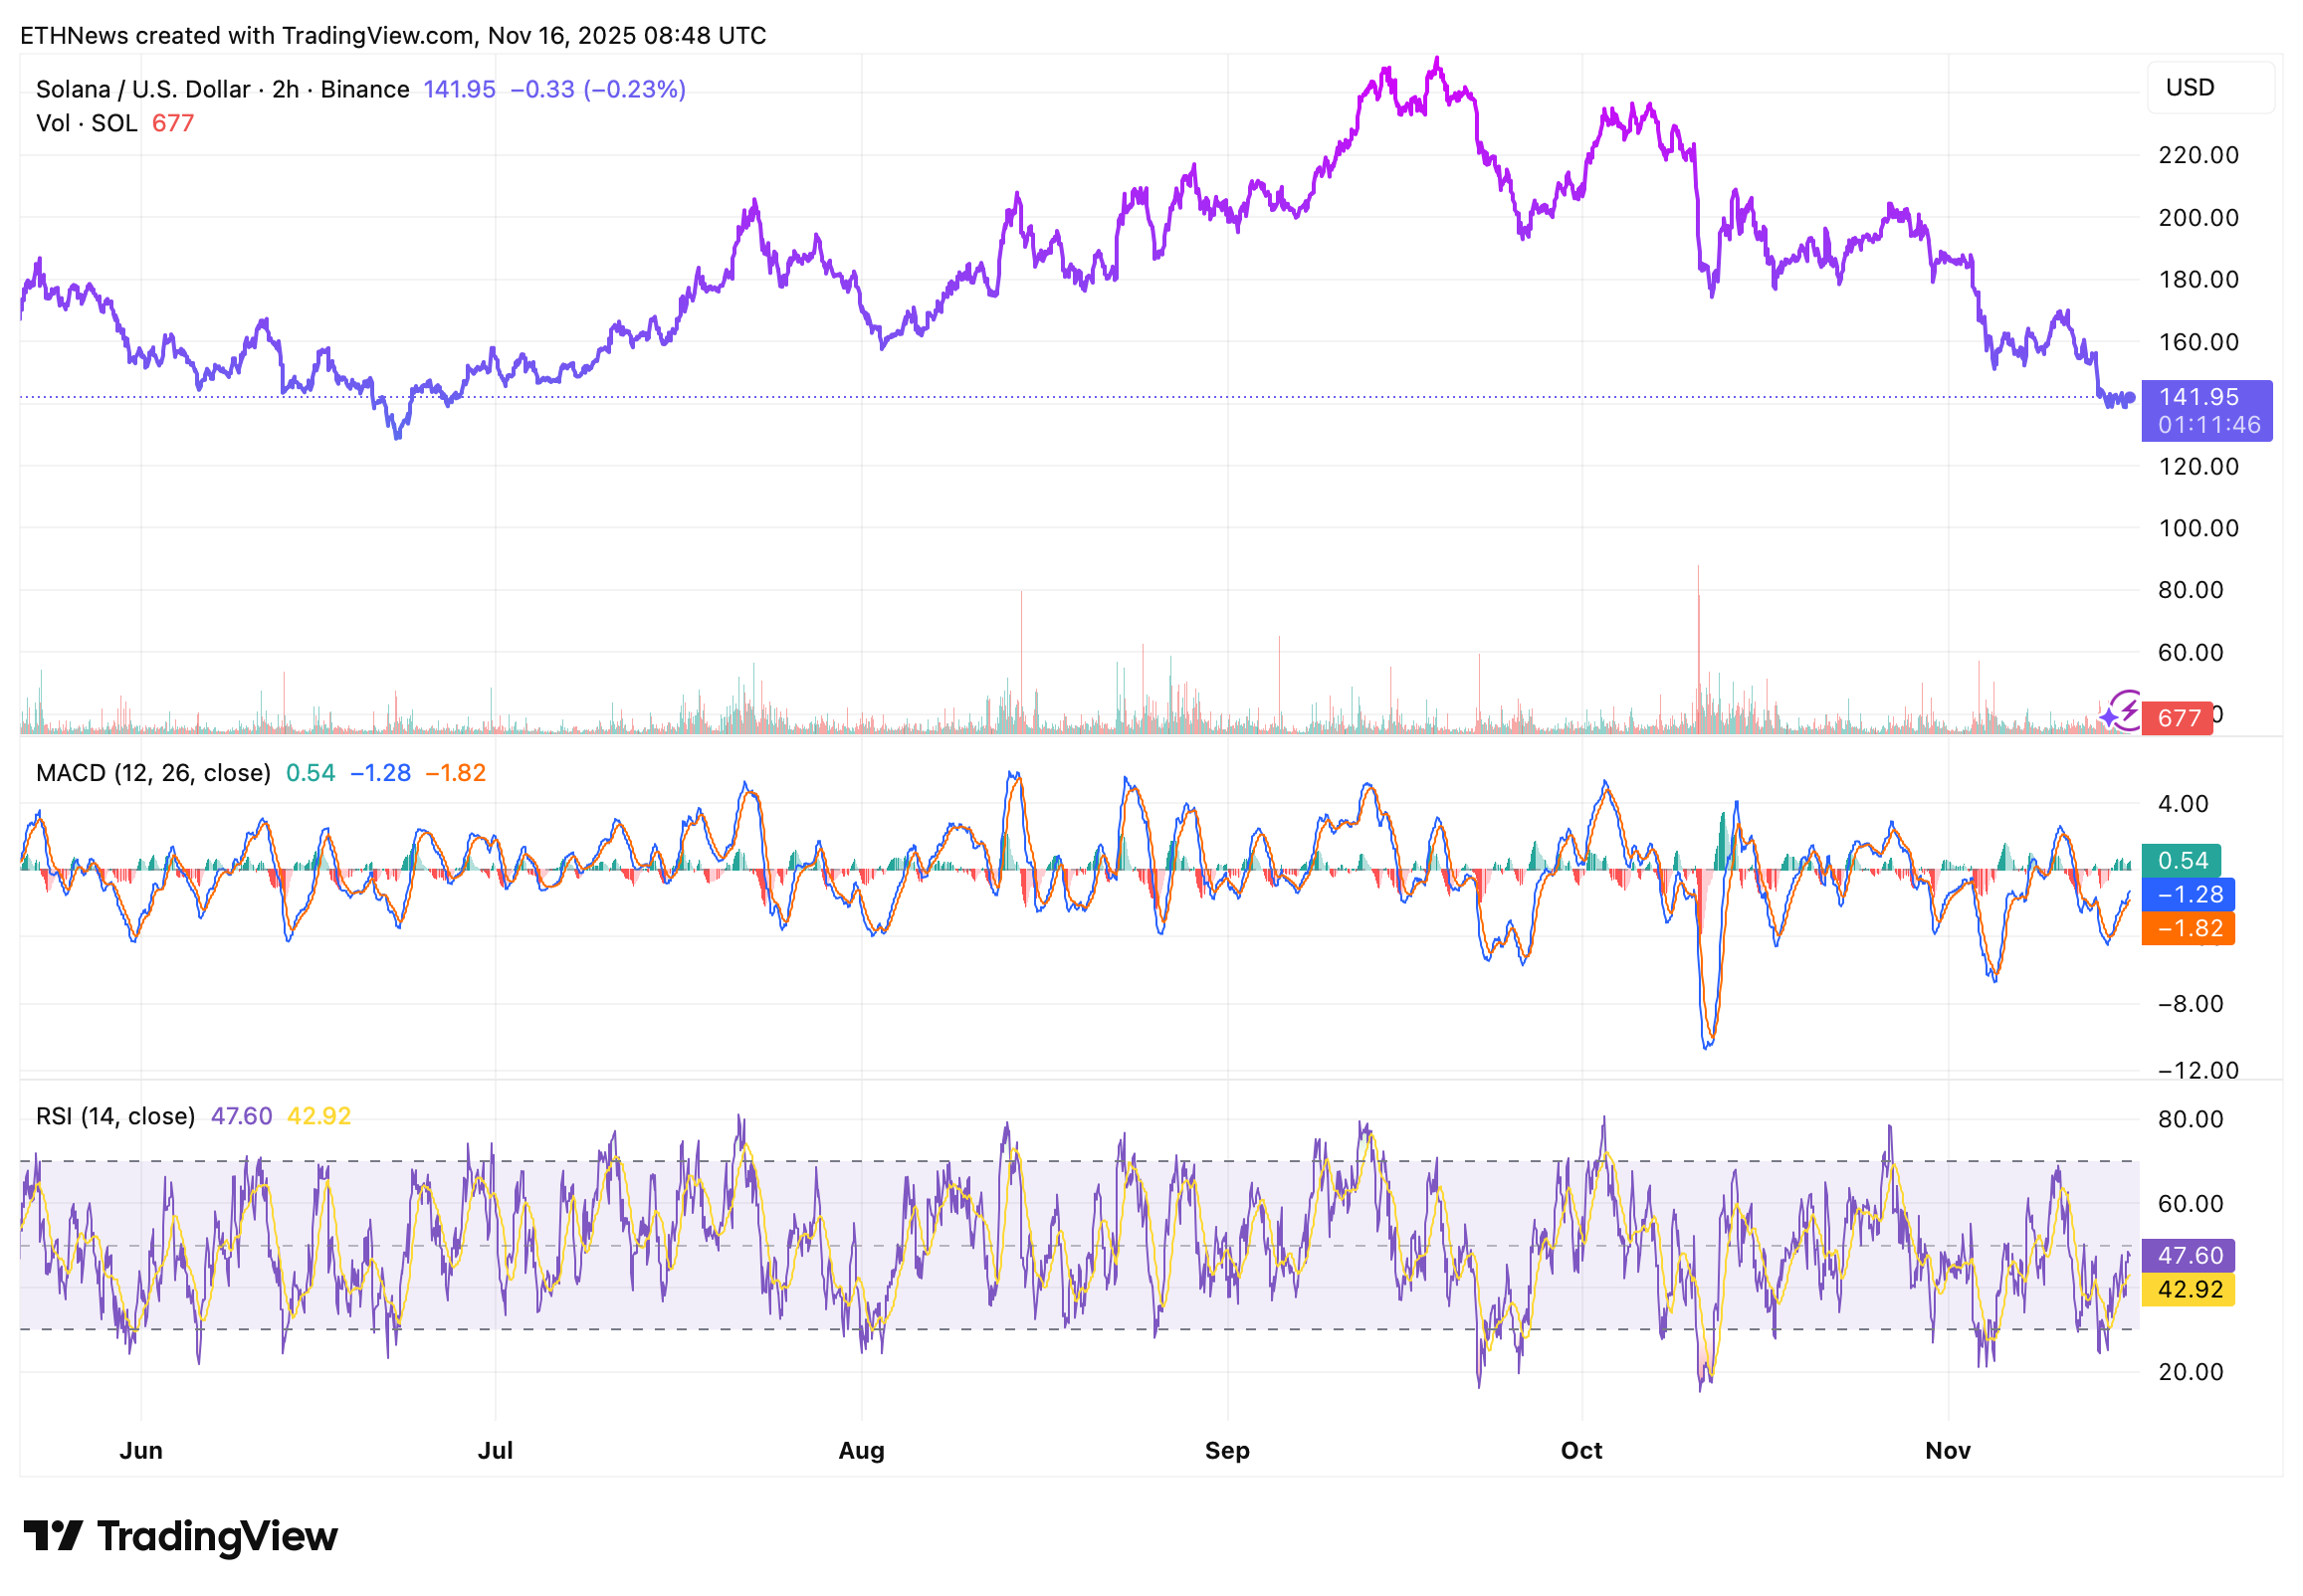
SOL is trading around $141–$142, recovering slightly from the sharp intraday sell-off but still locked in a steady downtrend. The latest data shows the token below both its 7-day and 30-day moving averages, confirming a clear bearish structure.
10x Research reports that SOL fell 11% this week, making it one of the weakest performers among major altcoins, even as ETFs continued attracting capital. This divergence highlights that ETF inflows alone are not enough to push price higher when broader traders remain risk-off.
The market’s reaction shows one thing clearly – institutional inflows are being overwhelmed by spot selling and deteriorating sentiment.
Key Support Levels Under Attack
On-chain metrics indicate that Solana’s market cap has now tested the critical ~$80B support zone, a region historically associated with price rebounds. The failure of SOL to bounce decisively from this level is raising concerns that the next leg down could develop if selling pressure accelerates.
From a chart perspective:
- •The 7-day MA has crossed sharply below the 30-day MA.
- •Relative performance vs. the broader market continues to weaken.
- •Volume declined on small bounces, signaling lack of strong buyers.
Unless SOL reclaims the $150 zone soon, analysts warn momentum may continue leaning bearish heading into the final stretch of November.
Momentum Indicators Point to Extended Weakness
Short-term indicators show mixed but fragile conditions:
- •RSI sits near 53, neither oversold nor showing strong bullish divergence.
- •MACD remains flat and near the zero line, failing to form an upward cross.
- •Intraday volatility increases have produced lower highs, suggesting sellers remain in control.
The lack of clear bullish signals on both lower and higher timeframes keeps SOL vulnerable to another retest of the $135–$138 area.
Price Outlook: What SOL Needs to Recover
For Solana to shift momentum, traders will be watching for:
- A daily close back above $150 to break short-term downtrend pressure.
- Increasing volume on green candles, indicating real spot demand.
- Stabilization above the 7-day MA, a signal that selling exhaustion may be near.
Until that happens, the path of least resistance remains sideways-to-lower, especially if global risk sentiment continues to deteriorate.
Conclusion
Solana’s price remains under significant pressure despite strong ETF inflows, illustrating a clear mismatch between institutional participation and real buying interest on the open market. With SOL stuck below key moving averages and testing crucial support zones, the coming days will determine whether buyers step in, or if the market prepares for another leg lower.
The price remains the dominant signal, and right now, it continues to point down.