
The Solana price experienced a decline of nearly 4% in the last 24 hours, trading at $194 as of 4 a.m. EST. This movement occurred alongside a 19% increase in trading volume, reaching $7.42 billion.
This price action follows the debut of the Bitwise spot Solana ETF yesterday, which recorded the highest first-day trading volume for any ETF in 2025. The Bitwise Solana Staking ETF (BSOL) saw $56 million in trading volume on its launch day, surpassing the initial trading volumes of other recently launched crypto ETFs, including those for XRP and Solana staking from REX Osprey.
Solana is catching the worldwide attention these days…
1️⃣ Solana’s first ETF launched in the U.S., hitting $56M+ trading volume on day one.
2️⃣ $8M traded in just 20 minutes, ranking among the most active crypto ETF debuts ever.
3️⃣ Western Union announced a USD-backed… pic.twitter.com/Kn2igQZRwf
— Lucky (@LLuciano_BTC) October 29, 2025
The launch of the ETF was a highly anticipated event, marking a significant milestone for Solana as it joins an exclusive group of cryptocurrencies with spot ETF products available. While such attention typically draws new buyers into the market, current indicators suggest that profit-taking and cautious investor behavior are exerting downward pressure on prices.
Recent analyses from market observers indicate that Solana's underlying fundamentals remain robust. The ongoing network upgrades and increasing interest from prominent asset managers like Bitwise, VanEck, and Fidelity highlight growing attention from institutional investors towards Solana.
🚀Solana ETF.. The Next Leap in Institutional Adoption.
The approval of a Solana ETF could mark one of the most transformative moments in digital asset history.
With its lightning fast transactions, scalable infrastructure, and thriving ecosystem, Solana (SOL) has already proven… pic.twitter.com/cRaWHzM3fr— Capitalism .nad base.eth🎒🇰🇷🇺🇲🌊RIVER (@xxxx_trader) October 29, 2025
Solana Price: Transaction Activity and Institutional Flows
On-chain data provides further confirmation of Solana's underlying strength. Wallet addresses and transaction activity on the Solana network have shown consistent growth, indicating genuine demand and active user participation. A greater number of coins are being moved off exchanges, suggesting that investors are inclined to hold their assets for longer periods, thereby reducing the immediate risk of widespread selling.
Staking metrics continue to perform well, with increased participation bolstering community confidence. Substantial treasury inflows are anticipated in the near future, as several digital asset funds are expected to allocate capital to Solana, driven by the ETF's success and improvements in the network's on-chain infrastructure. This trend is already being reflected in the rising volumes of staking and transactions.
Institutional purchases from ETF providers and asset managers are contributing to sustained support for Solana's price. As more companies and investment funds acquire spot SOL for their investment products, the intrinsic demand for the asset is growing. This ongoing trend has the potential to drive the price upward in the coming months, particularly if broader market conditions remain favorable.
SOLUSD Price Analysis and Technical Outlook
The weekly price chart for SOLUSD presents a mixed technical outlook. After reaching recent highs near $295.31, the price has experienced a pullback. Increased volatility has been observed as new buyers respond to ETF-related news and significant market movements.
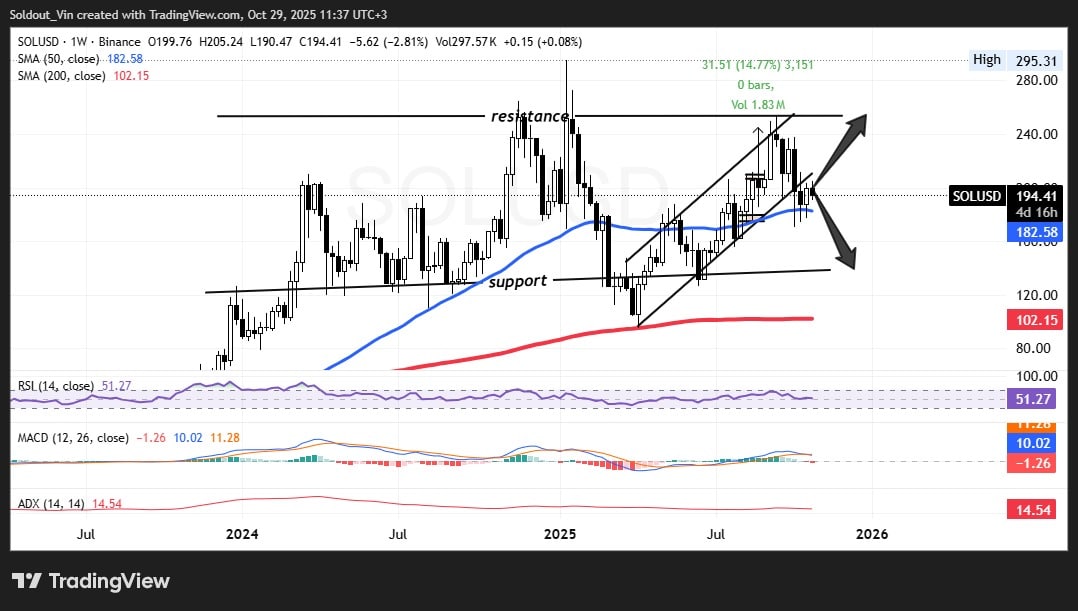
Key resistance levels are observed just above the $240 mark. Should Solana's price successfully break through this resistance, it could rapidly advance towards previous highs. Conversely, if buyers are unable to sustain the price, there is a risk of a downward movement, potentially retesting support levels at $182.58 and subsequently at $102.15.
The Relative Strength Index (RSI) stands at 51.27, indicating that SOL is currently in a neutral zone. The market is neither overbought nor oversold, suggesting that the next significant price movement will likely be triggered by new developments or a surge in trading volume. MACD readings of 10.02 and -1.26 signal mixed momentum, implying the absence of a clear trend at present, though buyers have not relinquished control.
The ADX indicator is at 14.54, which suggests that while there is some upward momentum, the overall strength of the trend is weak. This supports the notion that traders are awaiting a catalyst for a more substantial market move. As ETF products continue to attract capital and generate interest, volatility in the short term may increase.
Observing the chart, SOLUSD remains within an upward channel, with support identified at the 50-week Simple Moving Average (SMA) and resistance situated just above recent price peaks. Each rebound from support tends to attract new buyers, while price movements towards resistance can prompt profit-taking activities.
A decisive drop below the $182.58 level could empower sellers to initiate a correction towards the longer-term 200-week SMA, which is positioned near $102.15. On the upward trajectory, a strong advance beyond the current resistance zone would pave the way for a push towards the $240–$295 range.
Traders are closely monitoring ETF flows for further directional cues. Increased institutional buying could propel the price higher, though short-term sell-offs and profit-taking remain possibilities. Key price levels to watch in the coming weeks include $182.58 for support and $240 for resistance. Maintaining prices above the support level would preserve the existing uptrend, while a break below could lead to a more significant dip before renewed buying interest emerges.
In summary, Solana's price is holding at critical technical levels despite a recent decline. The substantial trading volume on its ETF debut and ongoing institutional flows provide strong backing for long-term growth prospects. On-chain participation is on the rise, and technical indicators suggest that market participants remain engaged. The upcoming weeks will be crucial in determining whether SOL can achieve new highs or if it needs to retest important support levels before continuing its upward trajectory.