
Key Insights
- •Solana price bounced from the wedge support, but the 100-day and 200-day EMA cross still indicates weakness.
- •A drop toward $125–$135 remains possible unless buyers successfully defend this zone.
- •The bounce will gain significant strength only if Solana price closes above $172, marking the beginning of a more robust recovery.
A Bounce Has Formed, but the Solana Price Chart Shows Caution
Solana price experienced a notable increase of almost 6% at press time, providing some relief to traders after weeks of consistent selling pressure. This upward movement has generated hope that Solana might be establishing a foundation for a rebound. However, the broader cryptocurrency market remains subdued, and the trajectory of Solana's price will largely depend on its reaction near several critical levels. Many market participants are keenly observing whether this current bounce is sustainable or if another decline is imminent.
Solana found support at the lower boundary of a falling wedge pattern. Falling wedges are often seen as bullish indicators, as they can signal a reduction in selling pressure as the price consolidates. This characteristic is why some traders adopted an optimistic outlook following the initial green candle.
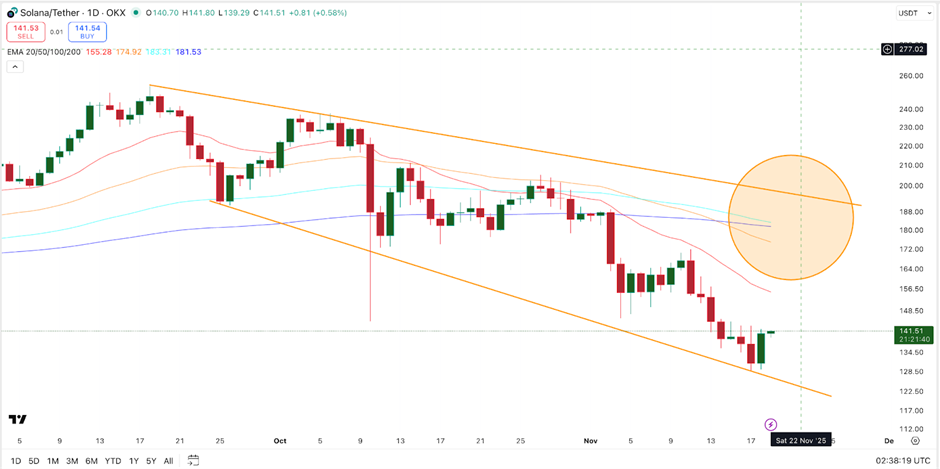
Despite the positive price action, the daily chart presents a cautionary signal. The 100-day Exponential Moving Average (EMA) is nearing a crossover below the 200-day EMA. These EMAs represent average prices over longer periods and a shorter EMA crossing below a longer one typically signifies a weakening trend. Although the crossover has not yet occurred, its proximity suggests that Solana could face renewed selling pressure even after the current bounce.
Currently, the price zone between $135 and $125 is the most critical area on the chart.
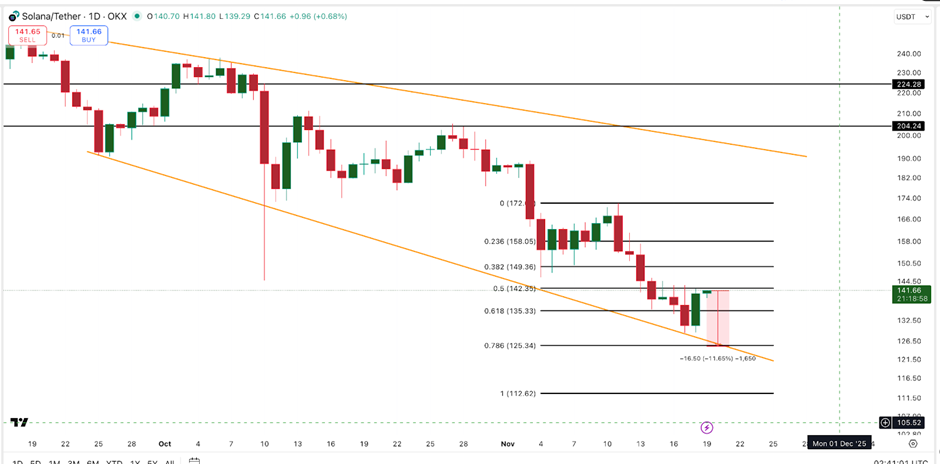
This range represents a potential pullback of approximately 12% from current trading levels and aligns with previous price reaction points, as well as key Fibonacci retracement levels. A sustained break below this zone could embolden sellers, while holding this area might allow buyers to establish a more significant bounce from this base.
Market Views Are Divided As Solana Tests Important Levels
Market sentiment regarding Solana's immediate future is mixed, with analysts offering differing perspectives as the price tests crucial levels.
One analyst has identified the $130 zone as a potential "load zone." This analyst believes that this level holds significant monthly support and typically attracts long-term investors looking for attractive entry points during price dips.
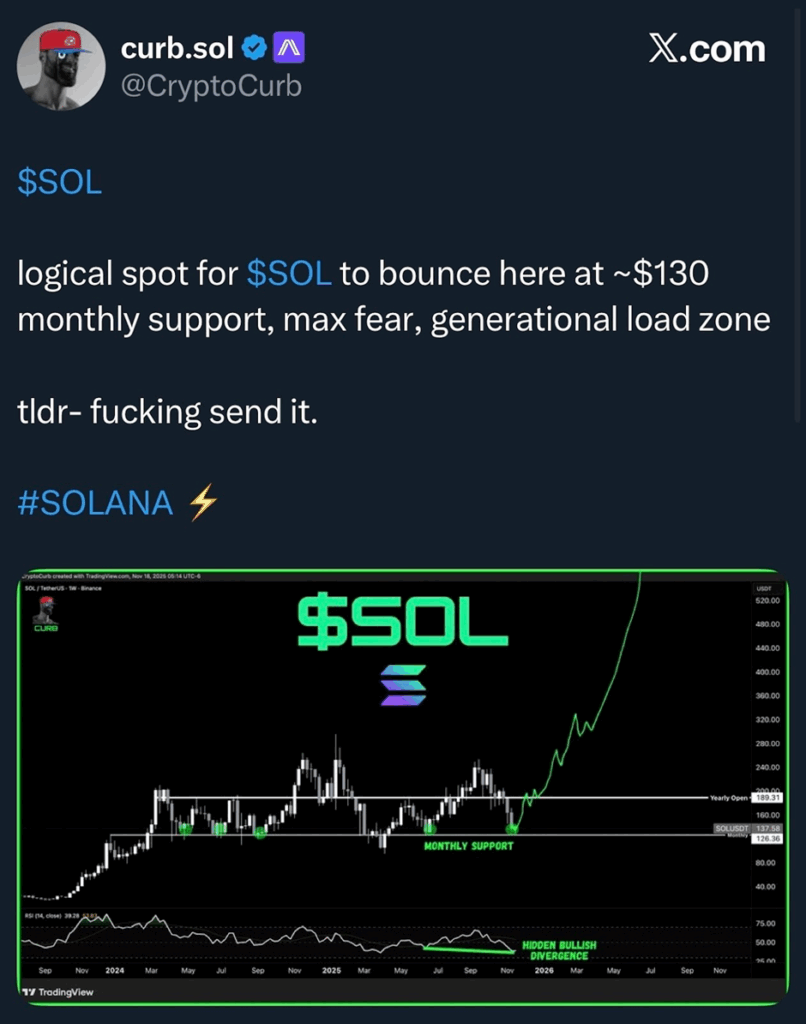
Another analyst suggests that the downside liquidity, representing areas where stop-loss orders and liquidations are concentrated, has largely been cleared. This perspective is based on market maps indicating that the next substantial liquidity pockets are situated near the $170–$200 range. According to this view, even a modest market recovery could propel Solana towards this higher zone, as the path above appears less obstructed.
The recent launch of a new ETF has introduced another dynamic to the market. Fidelity's FSOL, a Solana Exchange Traded Fund, is now operational. This development is considered a positive long-term indicator, offering traditional investors a straightforward avenue to gain exposure to Solana.
However, the presence of an ETF does not inherently shield a cryptocurrency from short-term price fluctuations. The immediate price direction over the coming days is still primarily dictated by technical chart patterns.
Furthermore, it is noteworthy that Solana's buying volume has increased in recent trading sessions, with several significant market players reportedly accumulating the asset. This activity could lend additional support to the current rebound scenario. Beyond price-specific movements, the underlying Solana network metrics remain robust, providing fundamental backing to the recovery thesis.
Key Levels Solana Price Must Clear for a Strong Recovery
For the current bounce to evolve into a more sustained and stable recovery, Solana's price must decisively break above the $172 mark, as indicated by the price chart.
This level has historically acted as a significant resistance, thwarting numerous prior attempts to move higher. A clear and decisive close above $172 would signal renewed strength from buyers. Until Solana achieves this, sellers are likely to maintain an advantage. This critical resistance level also aligns with the previously mentioned liquidity cluster narrative.
If Solana successfully defends the $135–$125 support zone and subsequently pushes above $172, traders may finally witness a more pronounced and clearer recovery phase. Surpassing this level would also position the price above the 20-day EMA, which has served as a consistent ceiling for the asset over the past several weeks.
At present, while Solana price has experienced a bounce, the looming EMA crossover and the crucial $135–$125 support area continue to highlight the persistent downside risk. The trading activity in the upcoming days will be pivotal in determining whether the current bounce gains momentum or if traders need to brace for further price pullbacks.