

SPX is entering a stronger phase after breaking through its short-term corrective pattern, with recent technical reactions pointing to a continuation setup supported by renewed directional flow.
Double Bottom Reinforces Market Support
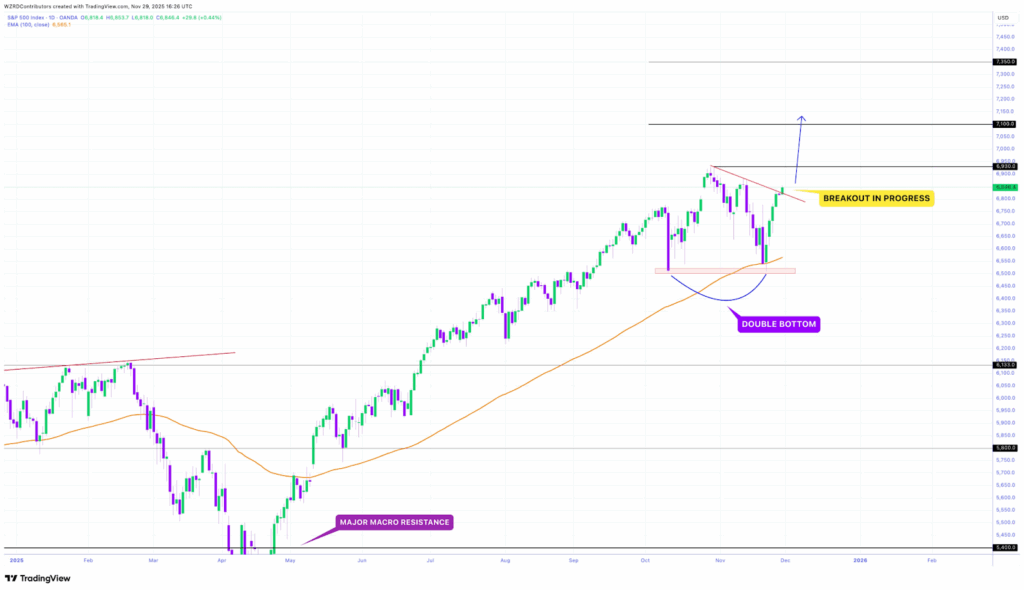
SPX regained strength from a zone that produced a clear double bottom, stabilizing the chart after a week marked by concerns of deeper weakening. The pattern showed buyers responding decisively on both tests, creating a base that shifted the tone across the structure. This response restored confidence around a level that had been watched closely throughout the recent pullback.
The reaction followed a retest of the 100 EMA, which has acted as a guide for the ongoing trend through the entire advance. Every interaction with this line has shown that deeper bids remain present, keeping the broader structure intact. The ability of SPX to respect this technical layer during volatility sent an early signal that the corrective phase remained orderly.
CRYPTOWZRD captured this shift by noting the double bottom and the supportive role of the 100 EMA, explaining that the setup aligned with past recoveries in the same trend. The chart behavior reflected consistency with earlier phases, giving the pattern the structure needed to transition back into strength.
Trendline Break Restores Directional Movement
Following the rebound from support, SPX moved toward the lower-high trendline that directed the recent cooling period. This line shaped the consolidation that developed during the pullback and marked the boundary separating hesitation from renewed movement. The breakout through the trendline signaled a shift away from compression and toward continuation.
The move occurred without disorderly trading, which helped confirm that the advance had institutional strength behind it. The clean break offered clarity that the market had absorbed selling pressure and returned to a more constructive trajectory. This transition marked the end of the corrective sequence that formed after the earlier rally.
Breaking this pattern also realigned SPX with the broader trend that has held since last year’s recovery. Each rotation has followed a similar structure, creating conditions that favor the type of price expansion now forming on the chart.
Path Toward the 7,100 Objective Opens
With structural conditions improving, attention now turns to the projected 7,100 level marked on the chart. This target comes from a measured expansion of the recent consolidation range and sits above the prior peak. SPX has followed similar proportional extensions throughout the current cycle, making the zone a logical next marker.
Momentum has returned as buyers regain control after the double bottom activation and the trendline breakout. This creates space for SPX to advance within the ongoing macro structure that has maintained consistency across each leg higher. The present setup aligns well with earlier phases that led to new highs within the same trend.
The market now progresses through a sequence that supports upward movement. With the 100 EMA holding and price no longer constrained by the corrective trendline, SPX is positioned to work toward the 7,100 region as the next structural destination.