

Uniswap has quietly slipped out of most market conversations, yet on-chain data suggests something different is unfolding beneath the surface. While UNI price has trended lower for weeks, a fresh data update hints that positioning may already be shifting. That contrast between price action and wallet behavior sets the tone for what analysts are now watching closely.
This perspective was recently highlighted by Santiment, whose data often tracks longer-term accumulation trends rather than short-lived sentiment swings.
According to Santiment, the 100 largest wallets have accumulated 12.41M UNI over the past 8 weeks. That accumulation matters because this specific wallet cohort has historically shown a tight correlation with Uniswap price behavior over longer periods.
You may not have Uniswap on your radar at the moment, but the 100 largest wallets have accumulated 12.41M $UNI in the past 8 weeks. Historically, these group of wallets correlate tightly with crypto's #32 market cap asset. A bullish divergence has been forming, which may lead… pic.twitter.com/NRfpGDlqBE
— Santiment (@santimentfeed) January 16, 2026
Santiment notes that Uniswap sits around crypto’s number 32 market cap ranking, which places it firmly within the range where accumulation patterns have previously preceded notable moves. The analyst commentary from Santiment frames this behavior as strategic rather than reactive, suggesting these wallets respond more to structure than short term volatility.
UNI Price Weakness Masks Subtle Signs Of A Shift
UNI price has been under pressure since mid December, reflecting a broader cooling phase across several Ethereum based assets. Despite that downtrend, the recent daily chart printed a hammer candlestick, a formation often associated with potential trend pauses or reversals.
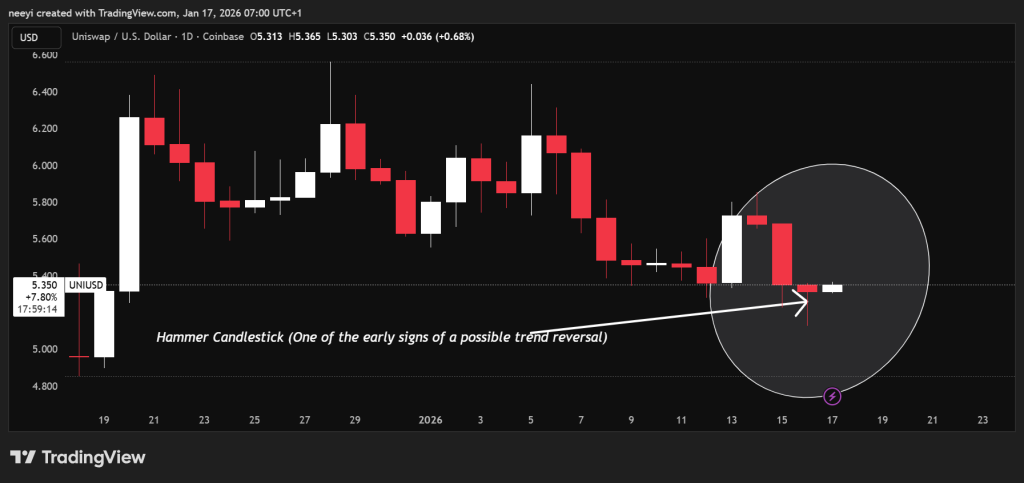
Today’s modest uptick builds on that signal, hinting that selling pressure may be losing momentum. While confirmation takes time, the shift aligns closely with the accumulation data highlighted by Santiment, creating a narrative where price weakness and wallet behavior diverge.
A closer look at the hourly chart shows early signs of stabilization. Momentum indicators have turned slightly constructive, suggesting that buyers may be positioning quietly while broader attention remains elsewhere.
This setup does not imply an immediate reversal. Instead, it points to a phase where downside risk begins to compress, often a precursor to directional expansion if momentum carries into higher timeframes.
UNI Hourly Indicators Hint At Growing Bullish Pressure
The current hourly indicators reflect improving conditions across several key metrics. The table below summarizes the readings and explains what each value suggests.
| Name | Value | Action |
|---|---|---|
| RSI 14 | 57.825 | Indicates growing buying strength without reaching extreme levels |
| STOCH 9,6 | 83.76 | Signals near term overbought conditions that may pause momentum |
| MACD 12,26 | 0.002 | Shows bullish crossover beginning to develop |
| CCI 14 | 100.6217 | Reflects strong upward momentum building |
| Highs Lows 14 | 0.0534 | Suggests price is starting to form higher structure |
| Bull Bear Power 13 | 0.0686 | Confirms buyers currently exert more control than sellers |
These readings suggest that if momentum continues, the hourly structure could expand into the daily timeframe, a shift that often changes broader trend dynamics.
Santiment’s analysis emphasizes that accumulation tends to matter most when it happens quietly. Uniswap price remains well below recent highs, yet the underlying data shows strategic positioning rather than abandonment.
Whether this develops into a sustained move will depend on broader market conditions, including Bitcoin’s direction. Still, the combination of wallet accumulation, early chart stabilization, and improving indicators places UNI back on the radar for observers tracking structural changes.