

Bitcoin price action has presented chart watchers with a pattern that is proving difficult to ignore. Analyst Tryrex (@Tryrexcrypto) shared a TradingView chart that draws a parallel between April 2022 and January 2026, suggesting a recurring historical sequence. This pattern involves Bitcoin reaching a peak, followed by a significant price sell-off, a period of consolidation within a defined range, and then a breakout that initially hints at recovery before the trend turns downward again.
Tryrex poses a direct question: will history repeat itself for BTC price, or will this cycle deviate from the established rhyme.
The analyst details the 2022 sequence, noting that after Bitcoin hit an all-time high, its price experienced a substantial drop of approximately 45% over a few challenging weeks. Subsequently, the price action stabilized into a tight consolidation phase that persisted for nearly four months, with distinct trendlines defining the trading range.
This consolidation phase is significant as it often appears to signal a market healing process. The price stops declining, candles begin to overlap, and the market seems to be rebuilding its underlying structure. Tryrex suggests that this phase set the stage for the subsequent market move, even though that move did not ultimately reward optimism.
BTC Price Fakeout Risk Emerges When Breakouts Lack Sustained Follow-Through
The chart analysis for 2022 illustrates a breakout attempt that ultimately proved to be a fakeout. Bitcoin's price briefly moved above the consolidation zone before rapidly reversing. The chart identifies this reversal as the point where the downtrend resumed, and the highlighted movement shows a sharp decline of about 19% from the fakeout area.
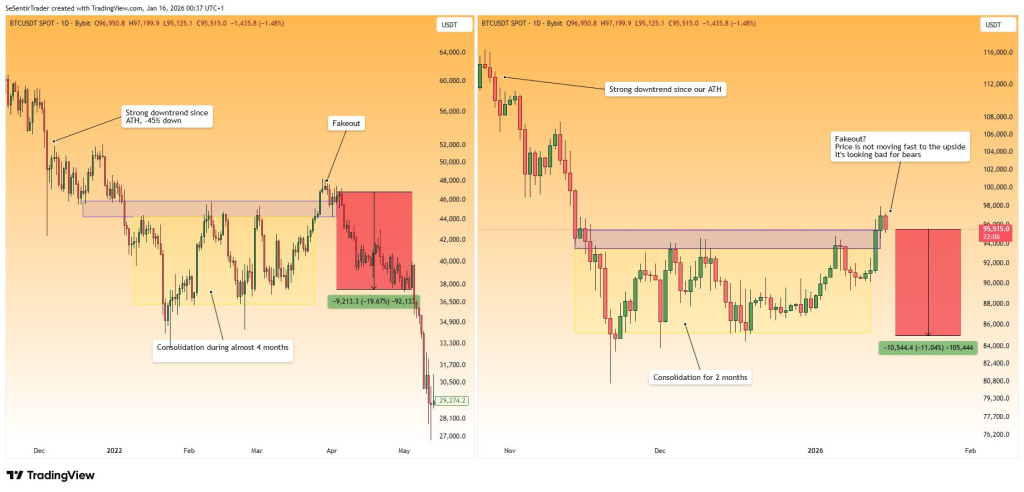
Tryrex applies this same analytical framework to the 2026 projection. Bitcoin has already experienced a significant downtrend since its most recent peak. Following this, BTC entered a sideways trading pattern for approximately two months. More recently, the price moved upward into a shaded resistance band, but the accompanying note on the chart raises questions about the move's strength due to its slow upward progress.
This observation forms the core of Tryrex's fakeout concern. Breakouts that fail to accelerate can quickly lose momentum, particularly when facing a prior resistance zone overhead.
Bitcoin Holding Near $95K Presents a Short-Term Stress Point
Tryrex specifically identifies the $95,000 level as a critical point that requires a swift recovery. The chart indicates BTC price hovering around $95,515 on the right side, near the area where the current breakout attempt is being evaluated. A projected downside range on the same panel points towards the mid-$80,000 region, representing an approximate 11% drop from the $95,000 zone.
This projection is not presented as a guarantee, and Tryrex frames it as a warning concerning market structure, the speed of price movements, and the necessity of follow-through. Bitcoin price must either consolidate and rebuild strength above the breakout area, or the current upward move risks being perceived as another short-lived surge.
The coming candles are crucial for determining Bitcoin's intentions, as the cryptocurrency often reveals its direction after initial excitement subsides. Tryrex has laid out a potential historical roadmap, and BTC price action will indicate whether this is a case of repetition or a new market cycle.