

Cardano Price Performance: A Month of Lower Highs
Cardano has traded in one of its weakest technical structures of the year over the past month. While Ethereum and Solana have shown sharp recoveries and entered stronger momentum phases, ADA has remained in a slow downward grind. The current chart indicates buyer exhaustion, declining volume, and several indicators suggesting the market is still seeking a bottom.
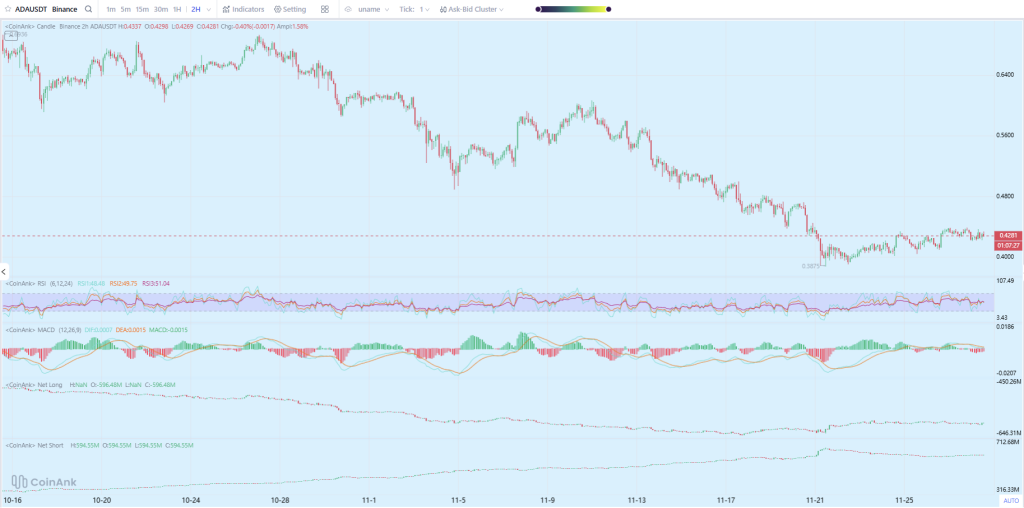
The 2-hour chart illustrates a persistent downtrend from mid-October to late November. The ADA price consistently printed lower highs and lower lows, falling from the $0.64 region into the $0.38–$0.43 zone. Every attempted bounce was met with aggressive selling, and none of the rallies managed to reclaim the mid-trend structure.
In summary, Cardano has been drifting sideways after losing a significant portion of its momentum. Compared to ETH and SOL, which have recovered strongly, ADA's performance has been among the weakest for Layer-1 cryptocurrencies.
ADA Chart Analysis: Support and Resistance Zones
Despite its weak momentum, the Cardano chart highlights two key areas of focus for traders:
Immediate Support:
- •$0.38–$0.40
This zone has supported ADA twice in November and represents the last line of defense before a deeper correction. A breakdown below this level could lead to a fall toward $0.34.
Immediate Resistance:
- •$0.47–$0.50
This area has rejected ADA multiple times. A confirmed reversal will not occur until ADA closes above this level on higher volume.
Currently, ADA is trading within a consolidation range without the strength to break upward, indicating it is stuck in the middle.
Cardano Momentum Indicators: RSI Analysis
The Relative Strength Index (RSI) has been hovering between 45 and 55, indicating a market lacking strong buying pressure. This is particularly concerning given the preceding downtrend; typically, oversold bounces would push the RSI into the 60–70 region, a move ADA has not achieved.
Interpretation:
- •Buyers are passive.
- •Sellers continue to control the trend.
- •There is no visible bullish divergence, suggesting no early reversal signal.
MACD Analysis: Flat and Losing Momentum
The Moving Average Convergence Divergence (MACD) on the 2-hour timeframe presents a similar picture. Throughout November, MACD generated small, shallow bullish waves that quickly lost power. Crossovers have been weak, and the histogram is flattening again.
This suggests:
- •Momentum is not building.
- •Buyers are hesitant.
- •The market is drifting rather than reversing.
ADA is expected to remain under pressure until the MACD prints a strong bullish wave above the zero line.
Net Long vs Net Short: Smart Money Is Not Accumulating
The net long and net short data provides a clear insight into market sentiment.
- •Net Longs are declining.
- •Net Shorts remain elevated and stable.
This imbalance indicates that larger traders are not positioning for a rally. Instead, they are either hedging their positions or anticipating further downside. Typically, when a token enters a strong accumulation zone, longs increase sharply and shorts decrease, but ADA is not exhibiting this behavior. This is not characteristic of strong market bottoms.
The mainstream media when I try to explain why #cardano has value. pic.twitter.com/BmPBOJtr51
— Altcoin Daily (@AltcoinDaily) September 27, 2025
Is ADA Falling Behind Other Layer-1s?
Yes, it is evident that Cardano is falling behind other Layer-1 cryptocurrencies.
Ethereum has reclaimed psychological levels and stabilized. Solana has emerged as one of the strongest assets of the year, experiencing aggressive climbs, attracting record on-chain activity, and gaining new users.
In contrast, Cardano:
- •Has not broken any significant resistance levels.
- •Remains far from its previous all-time high.
- •Exhibits weak trading demand.
- •Continues to lose attention compared to other Layer-1 competitors.
This market cycle has been challenging for slower ecosystems, and ADA's chart accurately reflects this sentiment.
ADA Price Outlook: December and Early 2026
Based on the current technical structure, the price outlook for ADA is as follows:
Bullish Scenario:
If the ADA price breaks above $0.50, momentum could drive it toward $0.58–$0.62. This scenario requires strong volume and overall market strength.
Neutral Scenario:
Consolidation between $0.38 and $0.47 is the most likely scenario unless new demand is triggered.
Bearish Scenario:
A breakdown below $0.38 would open the path toward $0.34, then $0.30, and potentially $0.26, depending on Bitcoin's trajectory.
Currently, ADA is not showing strong reversal signals.
Should Holders Sell ADA Now?
Here is a balanced, data-driven perspective for ADA holders:
Selling may make sense if:
- •You anticipate stronger returns from assets like SOL, ETH, or other higher-momentum altcoins.
- •You are dissatisfied with ADA's slow performance.
- •You wish to exit underperforming assets and reallocate to leading cryptocurrencies.
Holding may make sense if:
- •You have long-term conviction in ADA's staking capabilities, decentralization, and development roadmap.
- •You expect a broad altcoin rally where liquidity lifts all assets.
- •You are positioned for potential late-cycle pumps, which can occur for laggard assets.
However, based purely on the chart analysis, ADA remains in a clear downtrend, exhibiting low demand, flat indicators, and weak accumulation. There are no indications of an imminent strong breakout.