

The TRON (TRX) chart is illustrating a narrative that many traders might be overlooking. While the broader market has been focused on larger-cap cryptocurrencies, TRX price has been steadily advancing along its long-term uptrend and has recently completed a textbook retest of its major support line.
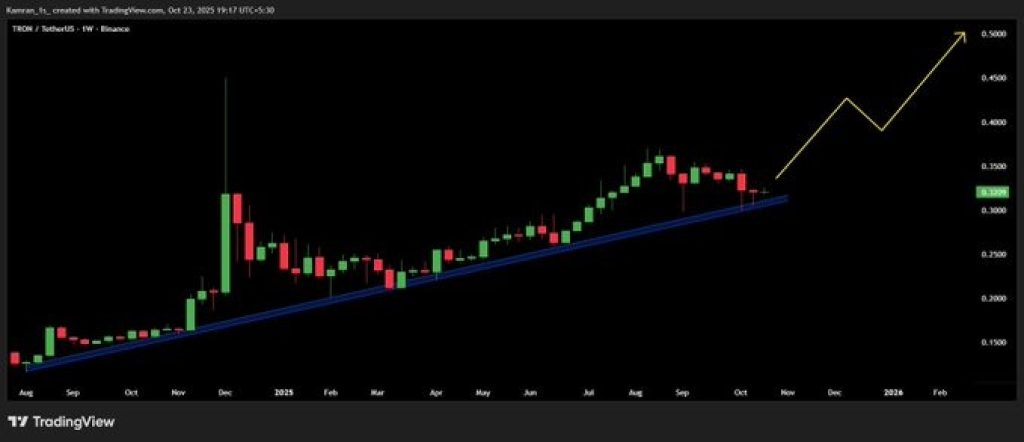
According to analyst Crypto Batman, this was not merely a minor bounce. On the weekly chart, TRON touched its ascending trendline with remarkable precision before reversing upwards. This is recognized by traders as a "touch-and-go" pattern, serving as a clear confirmation that buyers are actively defending the same level that has supported every significant rally since 2023.
Although the current price action may not appear explosive, this understated movement is precisely what makes it noteworthy. It represents the kind of steady, disciplined trading behavior that often precedes substantial market shifts.
What the TRX Chart Is Showing
The weekly price structure for TRON appears remarkably organized. Price action has consistently remained above its primary trendline for over a year, respecting it with exceptional accuracy. Each instance of touching this trendline has historically triggered a new impulse wave, and the latest of these is currently in development.
The projection shared by Crypto Batman outlines a clear trajectory: a gradual upward grind to rebuild momentum, followed by a brief dip intended to shake out less committed investors, and subsequently, a stronger push towards the $0.50 mark.
This $0.50 level represents a critical resistance zone dating back to 2021 and could emerge as the next significant target if the current upward momentum continues to build.
Furthermore, the chart exhibits no signs of panic. The candlesticks display long lower wicks, which are strong indicators of buying pressure. Trading volume remains stable, and volatility is contracting, a common setup that often precedes a significant breakout in one direction.
Why the Setup Stands Out
The consistency of TRON's performance is what makes this particular setup stand out. Even during recent pullbacks in Bitcoin's price, when many altcoins experienced declines, TRX price maintained its position. This demonstrates what analysts often refer to as "relative strength," indicating quiet resilience within a volatile market.
Experienced traders frequently utilize these types of retests to establish positions, and TRON's current structure aligns well with this strategy. Historically, every previous test of this same trendline has resulted in a multi-week ascent. While the broader market may not be rushing in yet, evidence suggests a slow but steady accumulation is occurring, which is a characteristic of a healthy trend preparing for expansion.
TRON Price Short-Term Outlook
As long as TRX maintains its position above the $0.32 level, the bullish setup remains intact. If momentum continues to increase, the price is likely to work its way back up towards $0.40, a significant psychological level that would confirm the next phase of the advance.
While the chart may appear calm on the surface, behind the scenes, TRON price is actively constructing its new trajectory. It is solidifying support, revitalizing market sentiment, and quietly positioning itself for what could be a more pronounced upward movement in the near future.