

Key Technical Observations for VELO
- •VELO is experiencing an 88% drawdown, mirroring its 2023 price action by reaching the 0.618 Fibonacci retracement level.
- •Trading volumes are increasing as the price forms a new consolidation zone around the $0.0058 mark.
- •Monthly charts indicate momentum compression, with traders anticipating a potential structural reclaim.
Cyclical Structure Returns to 88% Retracement Depth
VELO has retraced approximately 88% from its recent peak, a decline that mirrors its structural pattern observed in 2023. ChartNerdTA has pointed out that the token previously established its macro low after a similar decline when the price touched the 0.618 candle-wick retracement. The current chart is now approaching this same Fibonacci cluster with significant symmetry.
This price movement aligns with an (A)-(B)-(C) corrective sequence. The initial break initiated the (A) phase, followed by a fragile relief move during the (B) phase. The ongoing (C) leg has now pushed the price back into the deeper retracement level, echoing the pattern from 2023. In that instance, the final liquidation wick marked the end of seller pressure and laid the foundation for the subsequent market cycle.
VELO repeats an 88% drawdown while tapping the 0.618 wick retracement, matching its 2023 structure.
— ChartNerdTA (@ChartNerdTA) June 3, 2024
Trading volumes rise near cycle lows as price forms a new consolidation zone around the $0.0058 level.
Momentum compression appears on monthly charts as traders watch for a potential structural reclaim. pic.twitter.com/039q1z4r1h
Volume Behavior Tracks a Full Market Cycle
VELO's recent volume profile illustrates a progression through distribution, exhaustion, absorption, and capitulation phases. Earlier in the year, volume spikes frequently exceeded $40 million to $50 million when prices were trading between $0.08 and $0.12. This period indicated significant distribution by large holders as overall demand waned. Subsequently, the price drifted lower, with daily volume falling below $10 million.
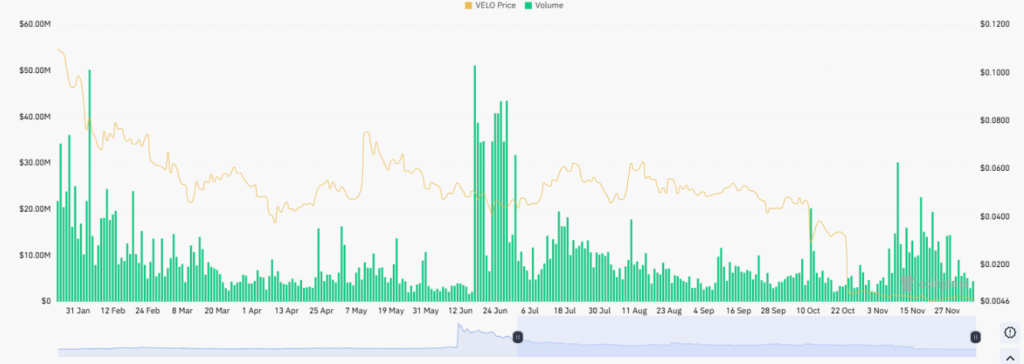
Activity shifted around mid-year, with a resurgence in volume while the price stabilized between $0.045 and $0.055. This suggested strong absorption rather than a renewed distribution phase. However, after failing to reclaim higher price levels, VELO declined into the $0.01 to $0.015 range. Within this zone, volume increased again, signaling potential accumulation as the price stopped making new lows.
Short-Term Metrics Show Higher Turnover at Depressed Prices
As of the latest one-month data, VELO is trading near $0.005895, representing a 12.82% decline over the past month. The current market capitalization stands at $103.54 million, with 24-hour trading volume at $12.12 million. This marks a notable increase in short-term activity. The volume-to-market-cap ratio of 11.8% indicates elevated turnover at these depressed price levels, coinciding with the ongoing consolidation.
During mid-November, VELO experienced a significant downward wave, falling from $0.0067 to approximately $0.0050. A subsequent rebound pushed the price back into the $0.0063 to $0.0065 range before momentum began to fade. The token is currently trading near $0.0058, with over 105,000 holders, suggesting that VELO remains sensitive to any surges in new volume.