

Understanding Ethereum's Market Phases
Ethereum's weekly chart is presented as a sequence of time-based phases rather than isolated price movements. The structure links price action with institutional and regulatory developments, showing how different periods reflect shifts in positioning and demand. By segmenting the timeline, the chart connects specific weekly candles to events that shaped Ethereum’s first clear institutional narrative.
Early Market Exposure and Limited Institutional Presence
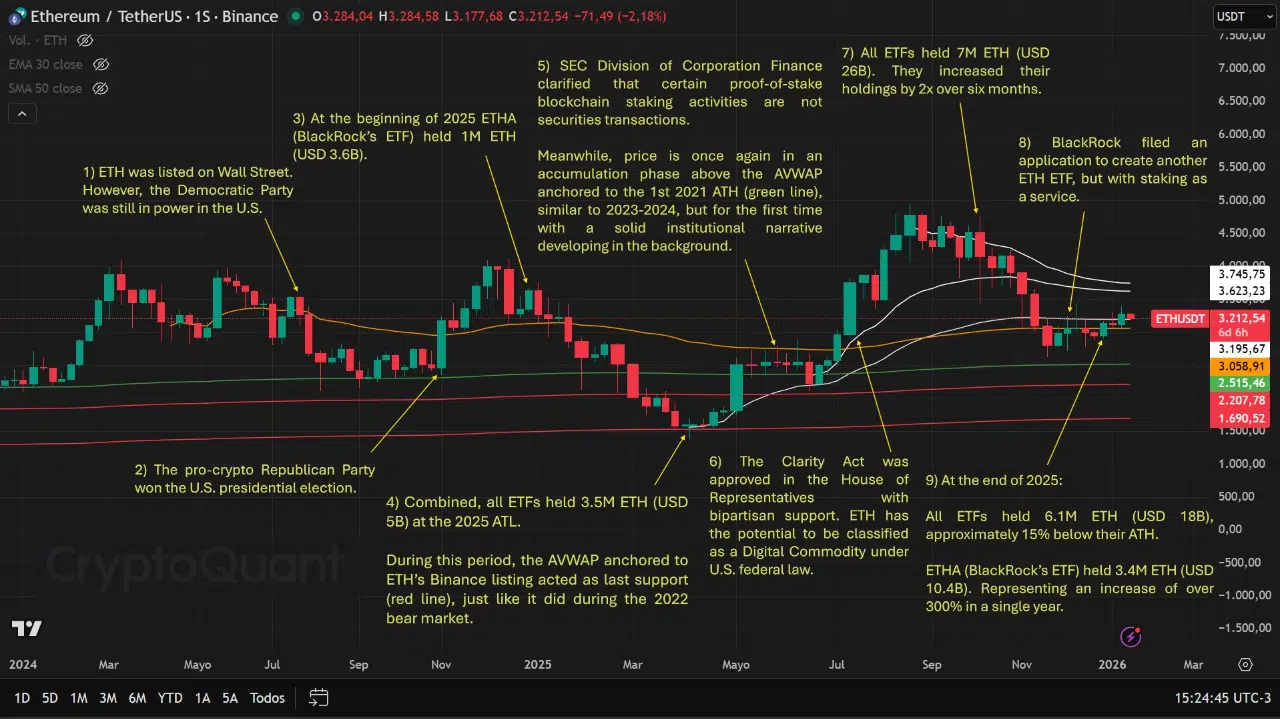
The initial phase highlights Ethereum’s listing on Wall Street while the Democratic Party remained in power in the United States. During this period, price action moved within a broad range without evidence of sustained institutional accumulation. Fund exposure remained modest, and the market structure reflected uncertainty rather than directional conviction. This phase establishes a baseline where price moved largely independent of meaningful ETF demand.
Cycle Low and Structural Support at the 2025 Bottom
As the timeline progresses, a political shift is marked alongside a notable market low in 2025. At that point, combined ETF holdings reached 3.5 million ETH, valued at $5 billion. Price found support near the anchored VWAP linked to Ethereum’s Binance listing, a level that had previously acted as a last line of support during the 2022 bear market. The alignment between reduced institutional exposure and structural price support underscores how downside pressure stabilized during this phase.
Regulatory Clarity and Renewed Accumulation
According to CryptoQuant, the narrative shifts meaningfully in early 2025 when ETHA, BlackRock’s Ethereum ETF, held 1 million ETH valued at $3.6 billion. Shortly after, the U.S. Securities and Exchange Commission’s Division of Corporation Finance clarified that certain proof-of-stake blockchain staking activities were not securities transactions. Within the same window, Ethereum re-entered an accumulation phase above its long-term anchored VWAP, this time with a developing institutional backdrop rather than an absence of demand.
ETF Expansion and Late-Stage Positioning
Later annotations show a rapid expansion in fund holdings. All ETFs combined reached 7 million ETH, valued at $26 billion, doubling exposure within six months. Price advanced before retracing, while the broader structure remained intact.
By the end of 2025, total ETF holdings stood at 6.1 million ETH, approximately 15% below their all-time high. ETHA alone held 3.4 million ETH valued at $10.4 billion, representing an increase of over 300% in a single year. These figures suggest Ethereum’s market behavior increasingly reflected institutional accumulation and repositioning cycles rather than purely speculative price action.