

The cryptocurrency market is experiencing a significant downturn, with Bitcoin (BTC) sliding to approximately $103,000 and testing a critical technical zone. This decline has pulled most altcoins lower. In stark contrast, Dash (DASH) has seen a remarkable surge, increasing by approximately 170% over the last week and about 55% in the past 24 hours, positioning it as a notable outlier in the current market.
Bitcoin's price is nearing a crucial support level, a breach of which could intensify fear and trigger further forced selling. Concurrently, most altcoins are showing losses for the week as market liquidity diminishes and investor risk appetite wanes. This market environment typically penalizes leveraged positions, making Dash's upward movement particularly noteworthy. However, traders are advised to remain aware of the potential for a swift mean reversion.
Factors Driving Dash's Ascent
Dash's recent performance can be attributed to a combination of derivatives market activity and product-related developments. From an on-chain and market microstructure perspective, an increase in Open Interest (OI) to nearly $100 million indicates a significant rise in leveraged positioning. Positive funding rates suggest aggressive long participation. In momentum-driven phases, rising OI coupled with positive funding can amplify upward price movements through short liquidations and trend-following behavior.
A key product catalyst is the introduction of Dash Pay's gift-card marketplace. This feature allows users to purchase gift cards directly within the Dash wallet. One storefront is currently live, with another in beta testing. The process involves users selecting a merchant, entering an amount, and confirming the transaction. The system leverages Dash's instant finality, enabling merchants to deliver gift cards immediately, with Dash settlements taking only 1-2 seconds, followed by near-instant card delivery. This effectively removes double-spend concerns and streamlines the checkout experience. Such practical, real-world utility can significantly boost narrative momentum, especially when the price chart is exhibiting a breakout pattern.
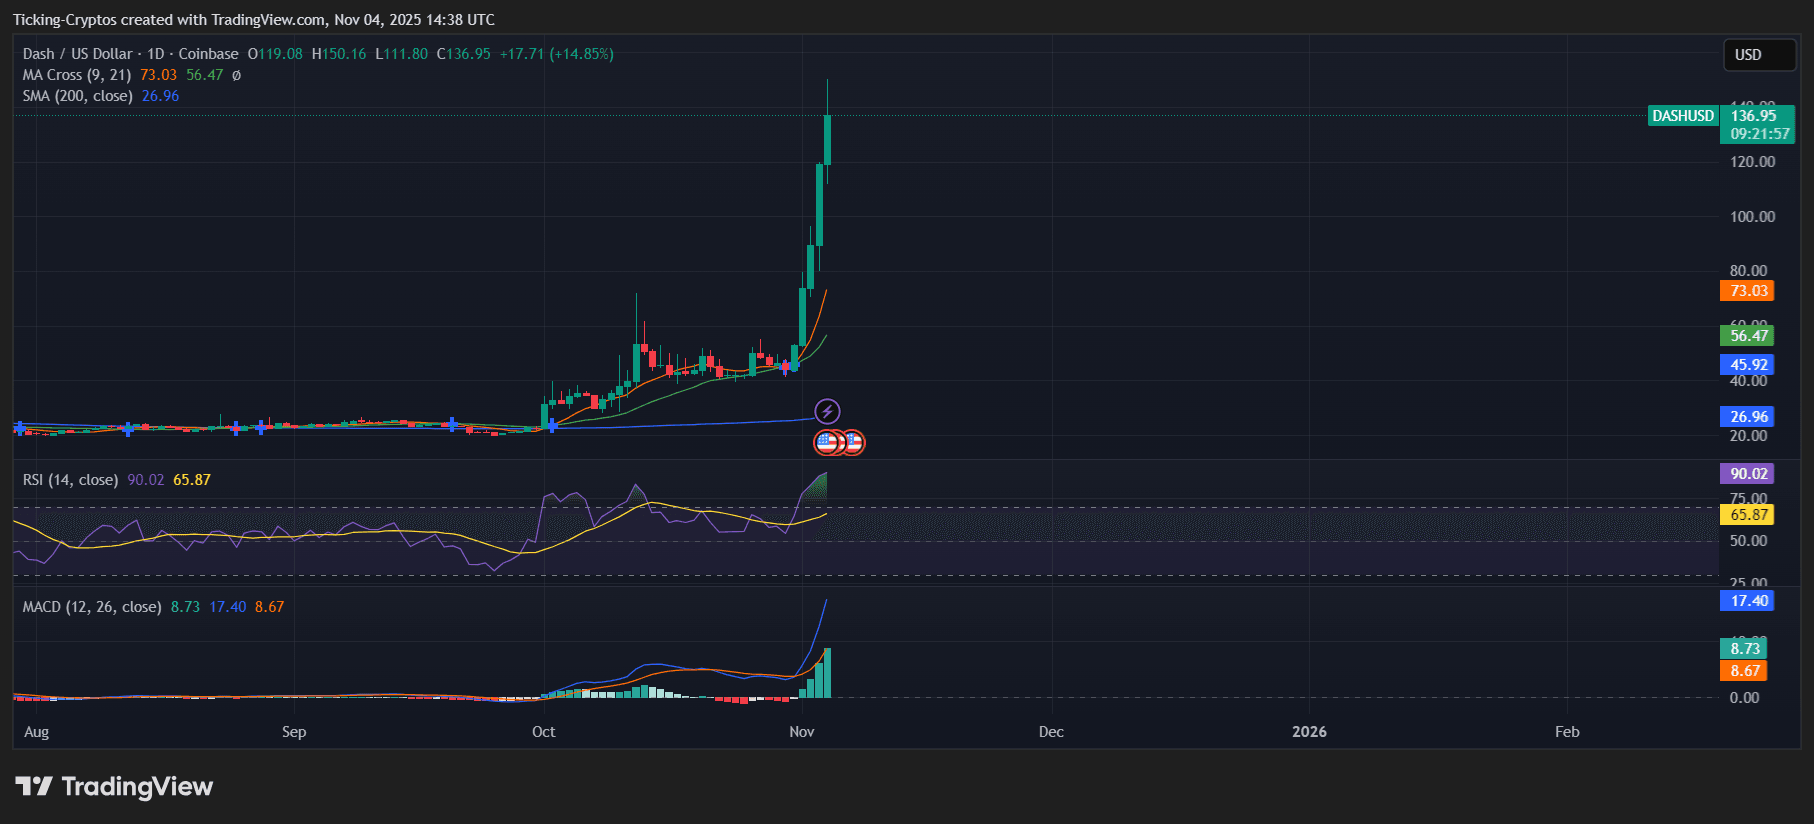
Dash Price Analysis
At the time of this analysis, Dash was trading around $137. The 9-day moving average is approximately $73 and rising sharply, while the 21-day moving average is around $56, and the 200-day simple moving average is at $27. The price action is described as parabolic, significantly exceeding all trend gauges, which are characteristic of a potential blow-off top.
The Relative Strength Index (RSI) for a 14-day period is around 90, indicating an extremely overbought condition. This suggests an increased risk of cooling off or sharp downward price movements. The Moving Average Convergence Divergence (MACD) shows strong positive expansion with a steepening histogram, indicating powerful but potentially late-stage momentum.
The current move is exceptional and driven by momentum, which invites both continuation and an elevated risk of pullbacks.
Key Levels and Scenarios
Immediate Supports (Potential Bounce Zones for a Fast Dip)
- •$120–$125: This zone represents prior intraday supply that may now act as potential support, serving as the first reaction area for a rapid decline.
- •$100–$105: A psychological round number combined with a recent breakout shelf.
- •$85–$90: A consolidation ledge identified before the recent vertical price increase.
- •$73 (9-day MA): The first dynamic trend support in a strong uptrend.
- •$56 (21-day MA): A target for a deeper mean reversion if momentum begins to fade.
- •$46–$47: A former resistance area on the price chart.
- •$27 (200-day SMA): This level is only relevant in the event of a complete market unwind, carrying a low probability unless the broader market breaks down significantly.
Upside Continuation (If Momentum Persists)
- •$150–$160: The initial extension zone where profit-taking often occurs after steep, vertical price candles.
- •$180–$200: A psychological magnet level that could be reached if derivatives continue to squeeze.
Will Dash Price Crash Next?
Following such a significant price increase, Dash's price could potentially experience a sharp correction due to several factors:
- •The RSI nearing 90 and the substantial vertical distance from the 9-day and 21-day moving averages indicate an unsustainable position historically, often requiring consolidation.
- •High and increasing Open Interest, along with positive funding rates, elevate the risk of a long squeeze occurring in response to any negative catalyst.
- •Broader market headwinds, such as Bitcoin decisively losing the $100,000 level, could lead to rapid evaporation of liquidity for altcoins, even for strong performers like Dash.
Trading Considerations (Not Financial Advice)
- •Momentum Strategy: This approach is recommended only for experienced traders. It involves implementing strict risk controls and avoiding the pursuit of vertical price movements on short timeframes (5–15 minutes).
- •Buy-the-Dip Logic: A strategy of placing staggered bids across key support levels, including $120–$125, $100–$105, and $85–$90, can help mitigate timing risk. Confirmations, such as strong price reactions and significant volume, are crucial for such entries.
- •Risk Management: It is advisable to reduce position sizing and strictly adhere to invalidation levels. Given the Open Interest nearing $100 million, a shift in funding rates can rapidly alter market dynamics.