

Renewed Focus on Target Box and Structural Levels
XRP is trading near a critical demand area as traders watch for confirmation above the $2.24 resistance level. The XRP is trading at a support area that is closely monitored and market participants are evaluating structural indicators and move derivatives in order to decide whether to establish a short-term bottom.
XRP entered a closely watched demand zone after completing a clean five-wave decline into the blue target box. The move followed the structured drop shared in the post from More Crypto Online, who noted the importance of observing market behavior in this area. The confluence of Fibonacci levels between $1.86 and $1.79 creates a region where traders expect a potential reaction.
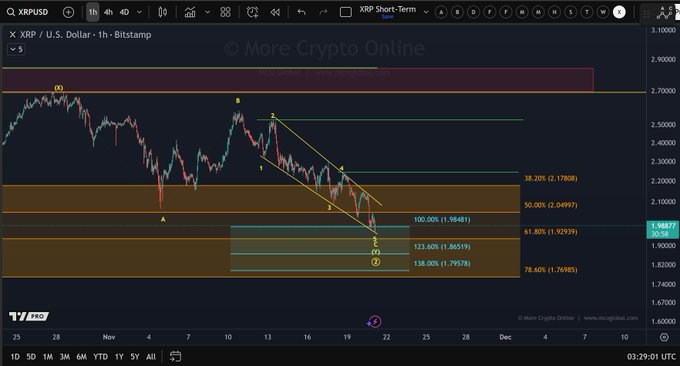
The broader pattern shows XRP forming an A-B-C corrective sequence after its early November high. The decline into the current zone aligns with textbook geometry often associated with completed C-waves. Traders now monitor how price interacts with the channel boundary drawn from the B-wave peak, as a break above this diagonal often signals early strength.
Attention also shifts toward resistance levels overhead. The $2.24 area remains the first structural pivot that traders want to see reclaimed. More Crypto Online noted this level as the key confirmation that a low may be forming. Until price breaks above that point, the possibility of extended downside remains open.
Short-Term Price Movement and Market Pressure
XRP as of writing, trades around $1.97 after a 7.7% drop in the past 24 hours. The token descended consistently as it rose from the high of the start of the sessions to a point that made lower highs and lows. The trend indicates the pressure of selling and diminished confidence in case of unsuccessful breakout attempts.
Trading volume reached $7B, showing elevated participation during the decline. The flow favored sellers, suggesting traders reduced exposure during the corrective phase. Market cap now stands at $118.3B, keeping XRP among top-ranked assets despite recent weakness.
Short-term traders are watching the $2.02–$2.05 region after multiple intraday rejections. Price must reclaim that zone before attempting a retest of the $2.10 level. Support remains at $1.95, with $1.90 acting as the next anchor should sellers push further.
Derivatives Shifts Reflect Caution and Repositioning
The derivatives market shows rising activity with restrained leverage. Volume grew 12.10% to $9.33B, and the open interest fell 8.81% to $3.39B. This pattern suggests position reductions following recent volatility.
Options activity offers a mixed picture. Options volume decreased 4.95%, yet open interest rose 5.97%, showing interest in holding positions for hedging rather than aggressive speculation. Funding rates near neutral indicate mild short dominance without extreme pressure.
Long and short ratios provide additional insight. Aggregate positioning shows a slight short bias at 0.9467, while Binance account ratios lean heavily long at 2.90. Top traders hold a more moderate 1.28 ratio. Liquidations over the past day reached $19.19M, with $17.12M in long positions affected, confirming a period of market reset.