

Key Technical Indicators for XRP
XRP's weekly MACD indicator is exhibiting early signs of a bullish crossover. This technical pattern was last observed prior to XRP's all-time high, suggesting a potential for significant upward price movement. Currently, the MACD line and signal line are converging, with the histogram bars showing a decrease in size, which indicates a possible shift in momentum. A confirmed crossover, where the MACD line moves above the signal line, would likely be closely watched by traders as a strong signal of an impending rally.
Furthermore, XRP is currently holding a significant 400-day support zone. This long-term support level has historically served as a strong foundation for price appreciation. Maintaining this support is considered crucial for XRP's potential ascent, especially in conjunction with the developing MACD setup. Past cycles have shown that XRP tends to experience substantial gains when these long-term support zones remain intact during periods of shifting momentum.
Short-Term Price Action and Potential Retest
While the long-term indicators are promising, short-term charts suggest a different immediate outlook. According to analyst @Morecryptoonl, XRP has recently dropped below the $2.109 level, which was identified as a primary signal area. Following this breach, the next critical support level expected to be tested is $2.03. The analyst also indicated the possibility of a more substantial price top being in place.
Analysis of the 30-minute chart reveals a completed ABC correction pattern. The recent upward movement reached $2.263, nearing the 61.8% Fibonacci retracement level, before reversing downwards. Should the $2.03 support level fail to hold, XRP's price could potentially decline into the zone between $1.77 and $1.68.
XRP is in a crucial zone. The weekly MACD is showing early signs of a bullish crossover, last seen before its all-time high. The price is holding a 400-day support zone, which has historically acted as a strong launch point. Short-term charts, however, suggest a correction is underway, with $2.03 as the next critical support level to watch. A break below this could lead to further downside.
— ChartNerdTA (@ChartNerdTA) May 15, 2024
Current Market Data and Outlook
At the time of reporting, XRP was trading at $2.07. Over the preceding 24 hours, the price experienced a decline of 3.3%, and the total drop over the past week stood at 3.1%. The trading volume in the last 24 hours was recorded at $3.35 billion. Despite the recent price dip, trading volume has remained steady, indicating continued interest from traders. Market participants are closely monitoring both the short-term price action and the long-term MACD pattern. A confirmed bullish crossover on the weekly MACD could significantly influence market sentiment and potentially trigger new price rallies.
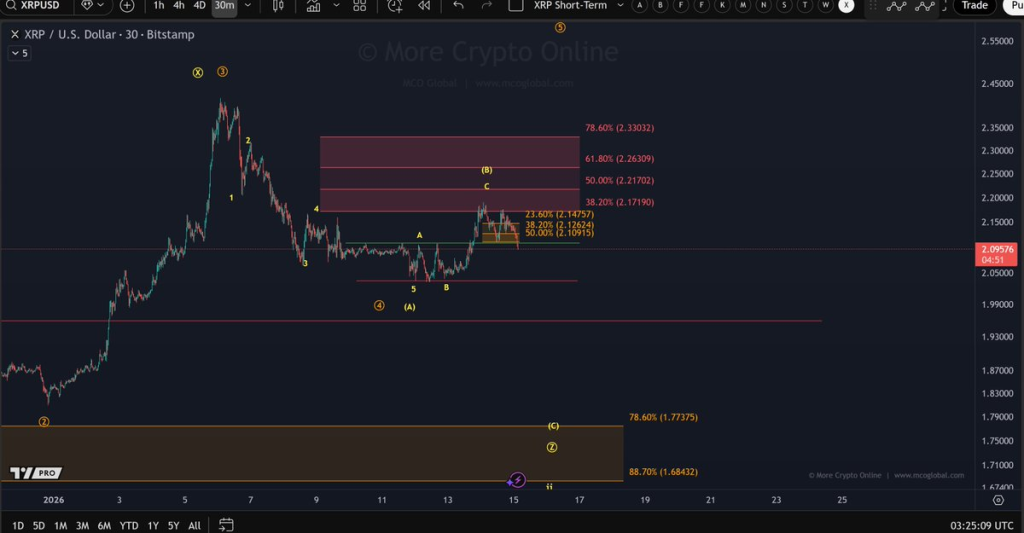
“We might have a more substantial price top in place.”